There are a number of Level 2 and 3 NISAR products that are suitable for use in GIS, as described in the using GIS software overview.
NISAR Support in ArcGIS Pro
Support for the NISAR file format was added to ArcGIS Pro at version 3.4 (November 2024). Those using version 3.4.0 or newer are able to use NISAR products as they would any other HDF5 file in ArcGIS Pro.
When using older versions of ArcGIS Pro, refer to this documentation for guidance.
ArcGIS Pro refers to HDF5 datasets as variables, and this documentation page will use that term.
NISAR in ArcGIS Tutorials
This page provides a quick introduction to working with NISAR data in ArcGIS. More in-depth tutorials are also available:
The NISAR in GIS tutorial provides step-by-step guidance for adding NISAR data to an ArcGIS Pro project, visualizing the data, and using standard and SAR-specific imagery and analysis tools, focusing on the GCOV and GUNW products.
The Spatial Subsetting for NISAR Data tutorial demonstrates workflows for subsetting NISAR products and transforming them to other data formats.
Adding NISAR Data
There are multiple options available for adding NISAR data to an ArcGIS Pro project. You can use the Add Multidimensional Raster tool or simply Drag and Drop the HDF5 file from the table of contents. Step-by-step guidance for each method can be found in the NISAR Data in ArcGIS Pro section of the NISAR in GIS tutorial.
Add Multidimensional Raster Tool
Using the Add Multidimensional Raster tool provides more flexibility in how the variables are displayed.
Variables can each be added as individual layers or combined into multivariate or multiband rasters.
If you want to work with the variable in its native HDF5 format, this is the best option to use.
1. Select Multidimensional Data from the Add Data menu
Click on the Map menu
Click on the bottom half of the Add Data button to open the menu
Select Multidimensional Data to open the Add Multidimensional Data dialog window
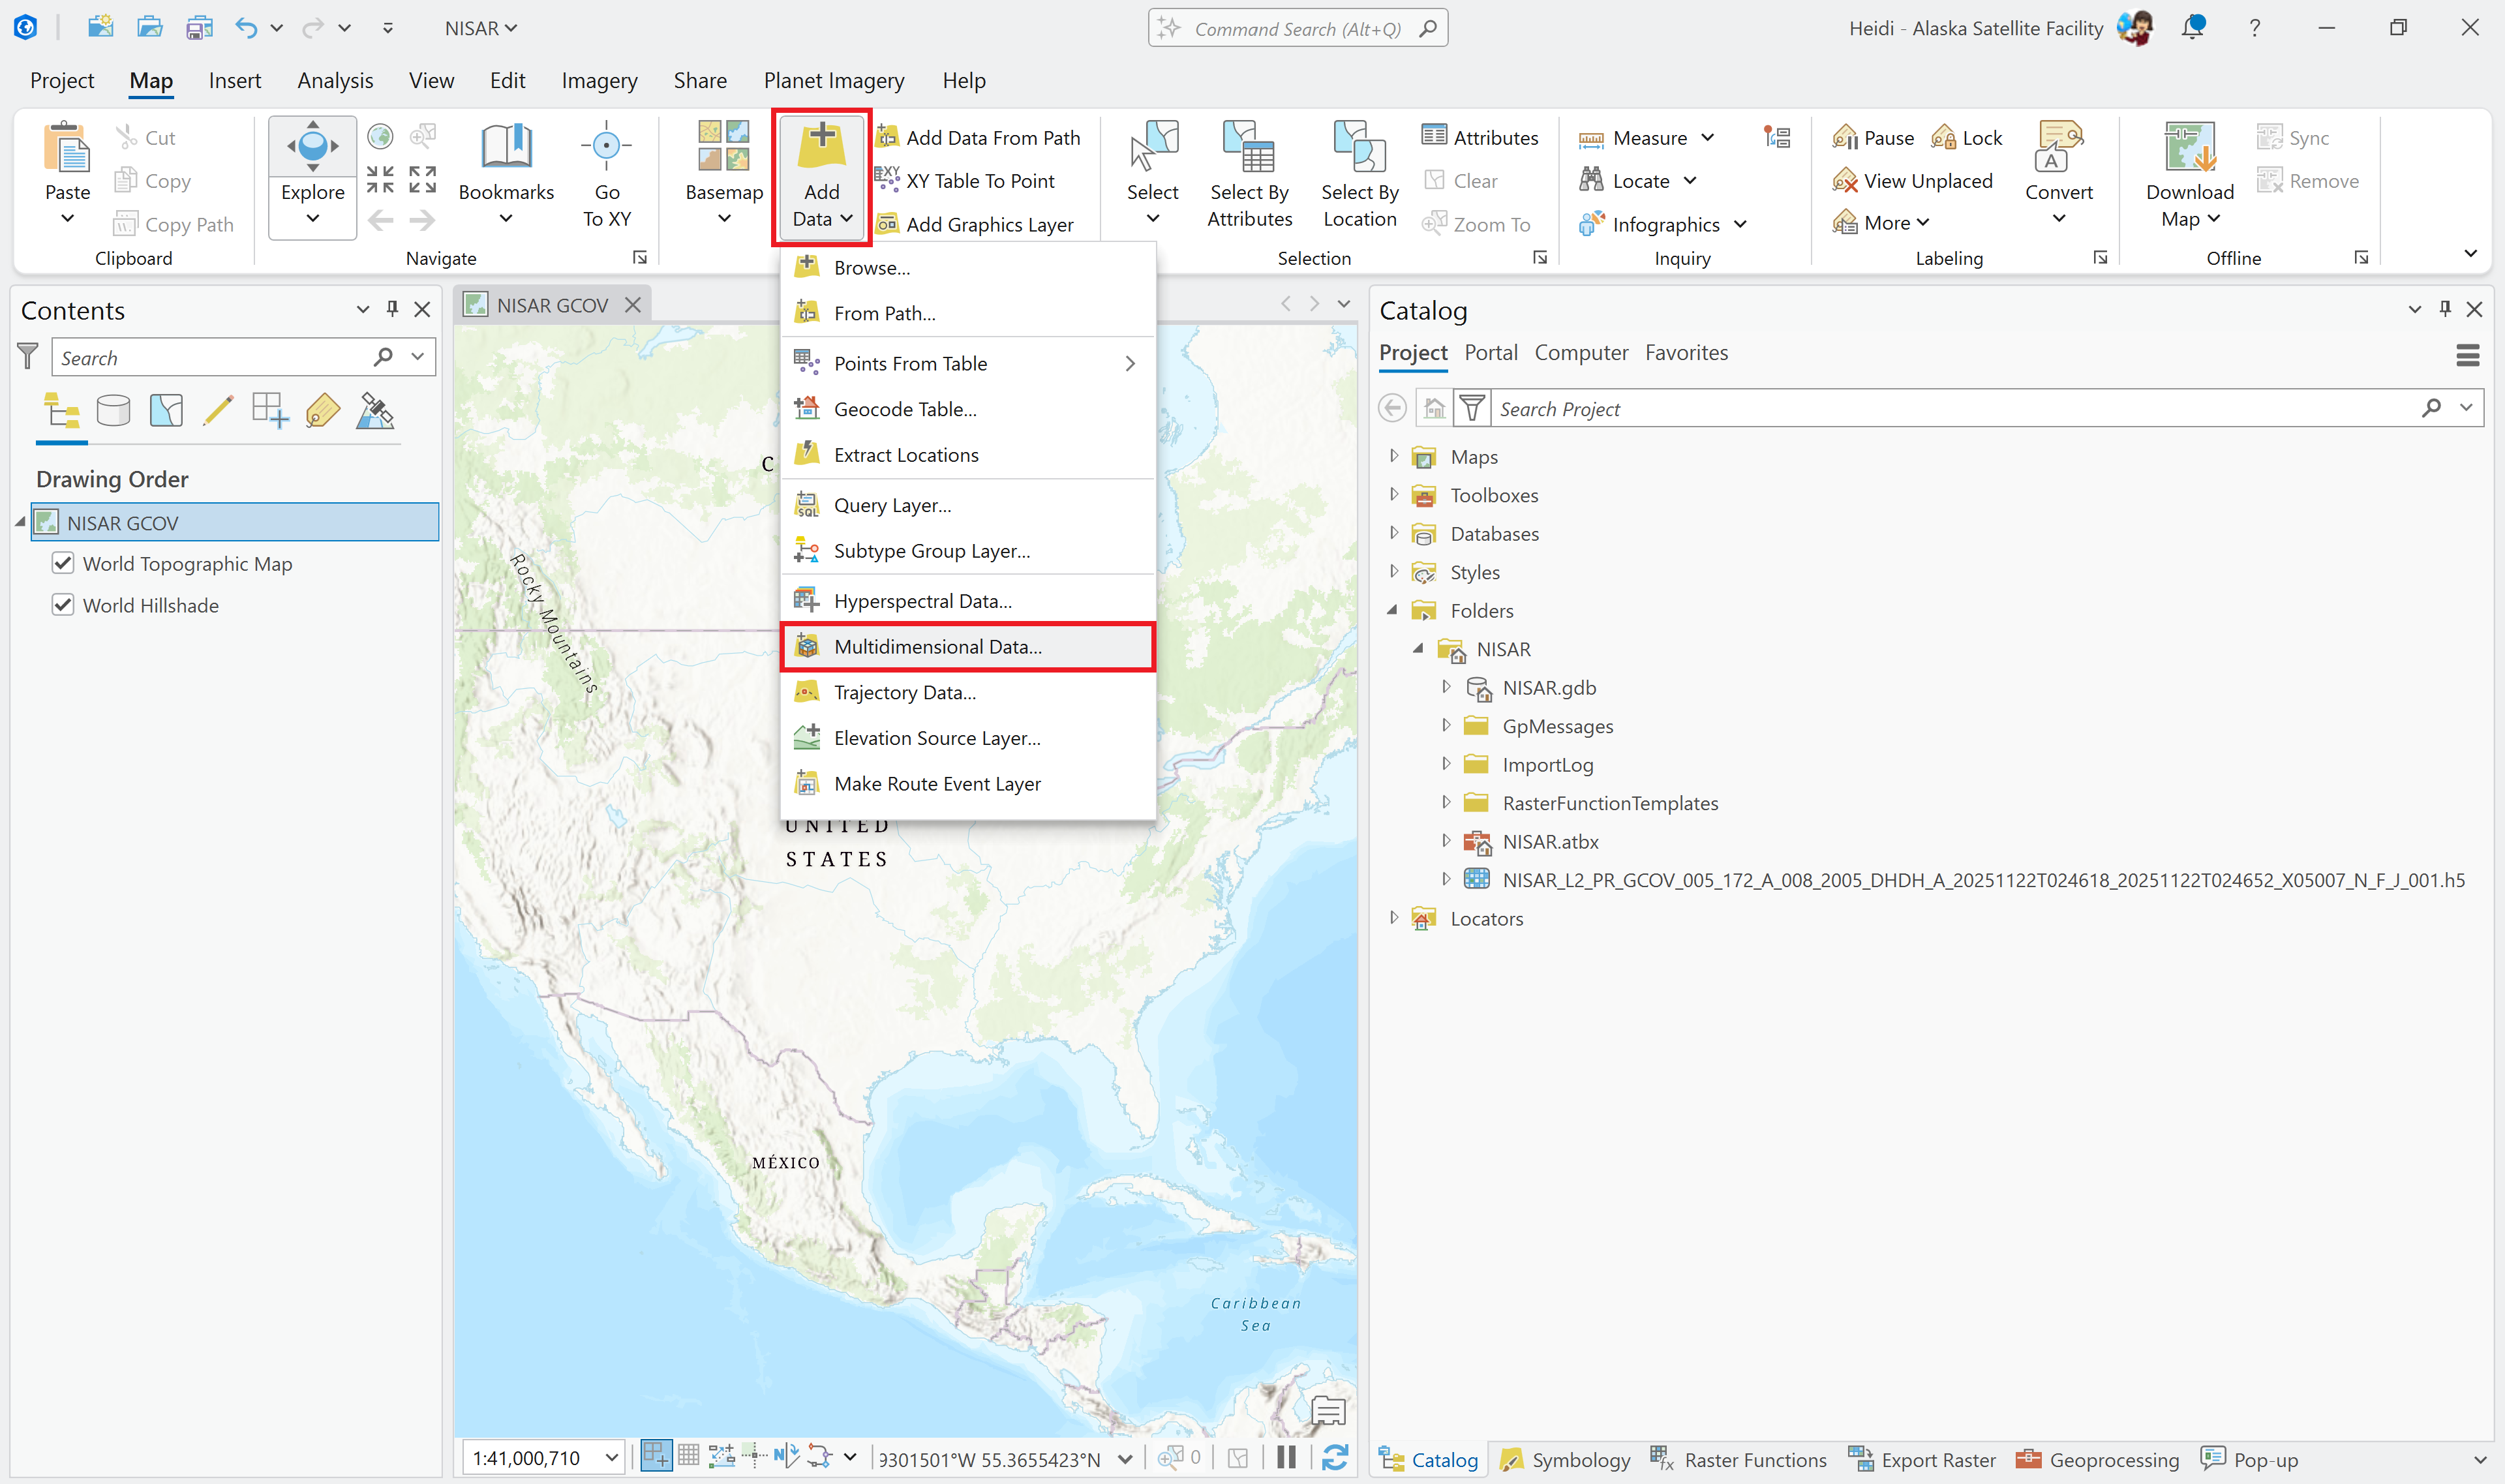
Figure 1:Click the Add Data menu and select Multidimensional Data to open the Add Multidimensional Data dialog window ArcGIS Pro.
2. Select Desired Variables
Click the Browse icon in the Add Multidimensional Data dialog box
Navigate to a NISAR file and select it to view the available variables
Check the box next to the variable(s) you want to add to the map
Leave the Output Configuration set to
Multidimensional Rasterto add each selected variable as its own layer in the mapClick OK to add the variables
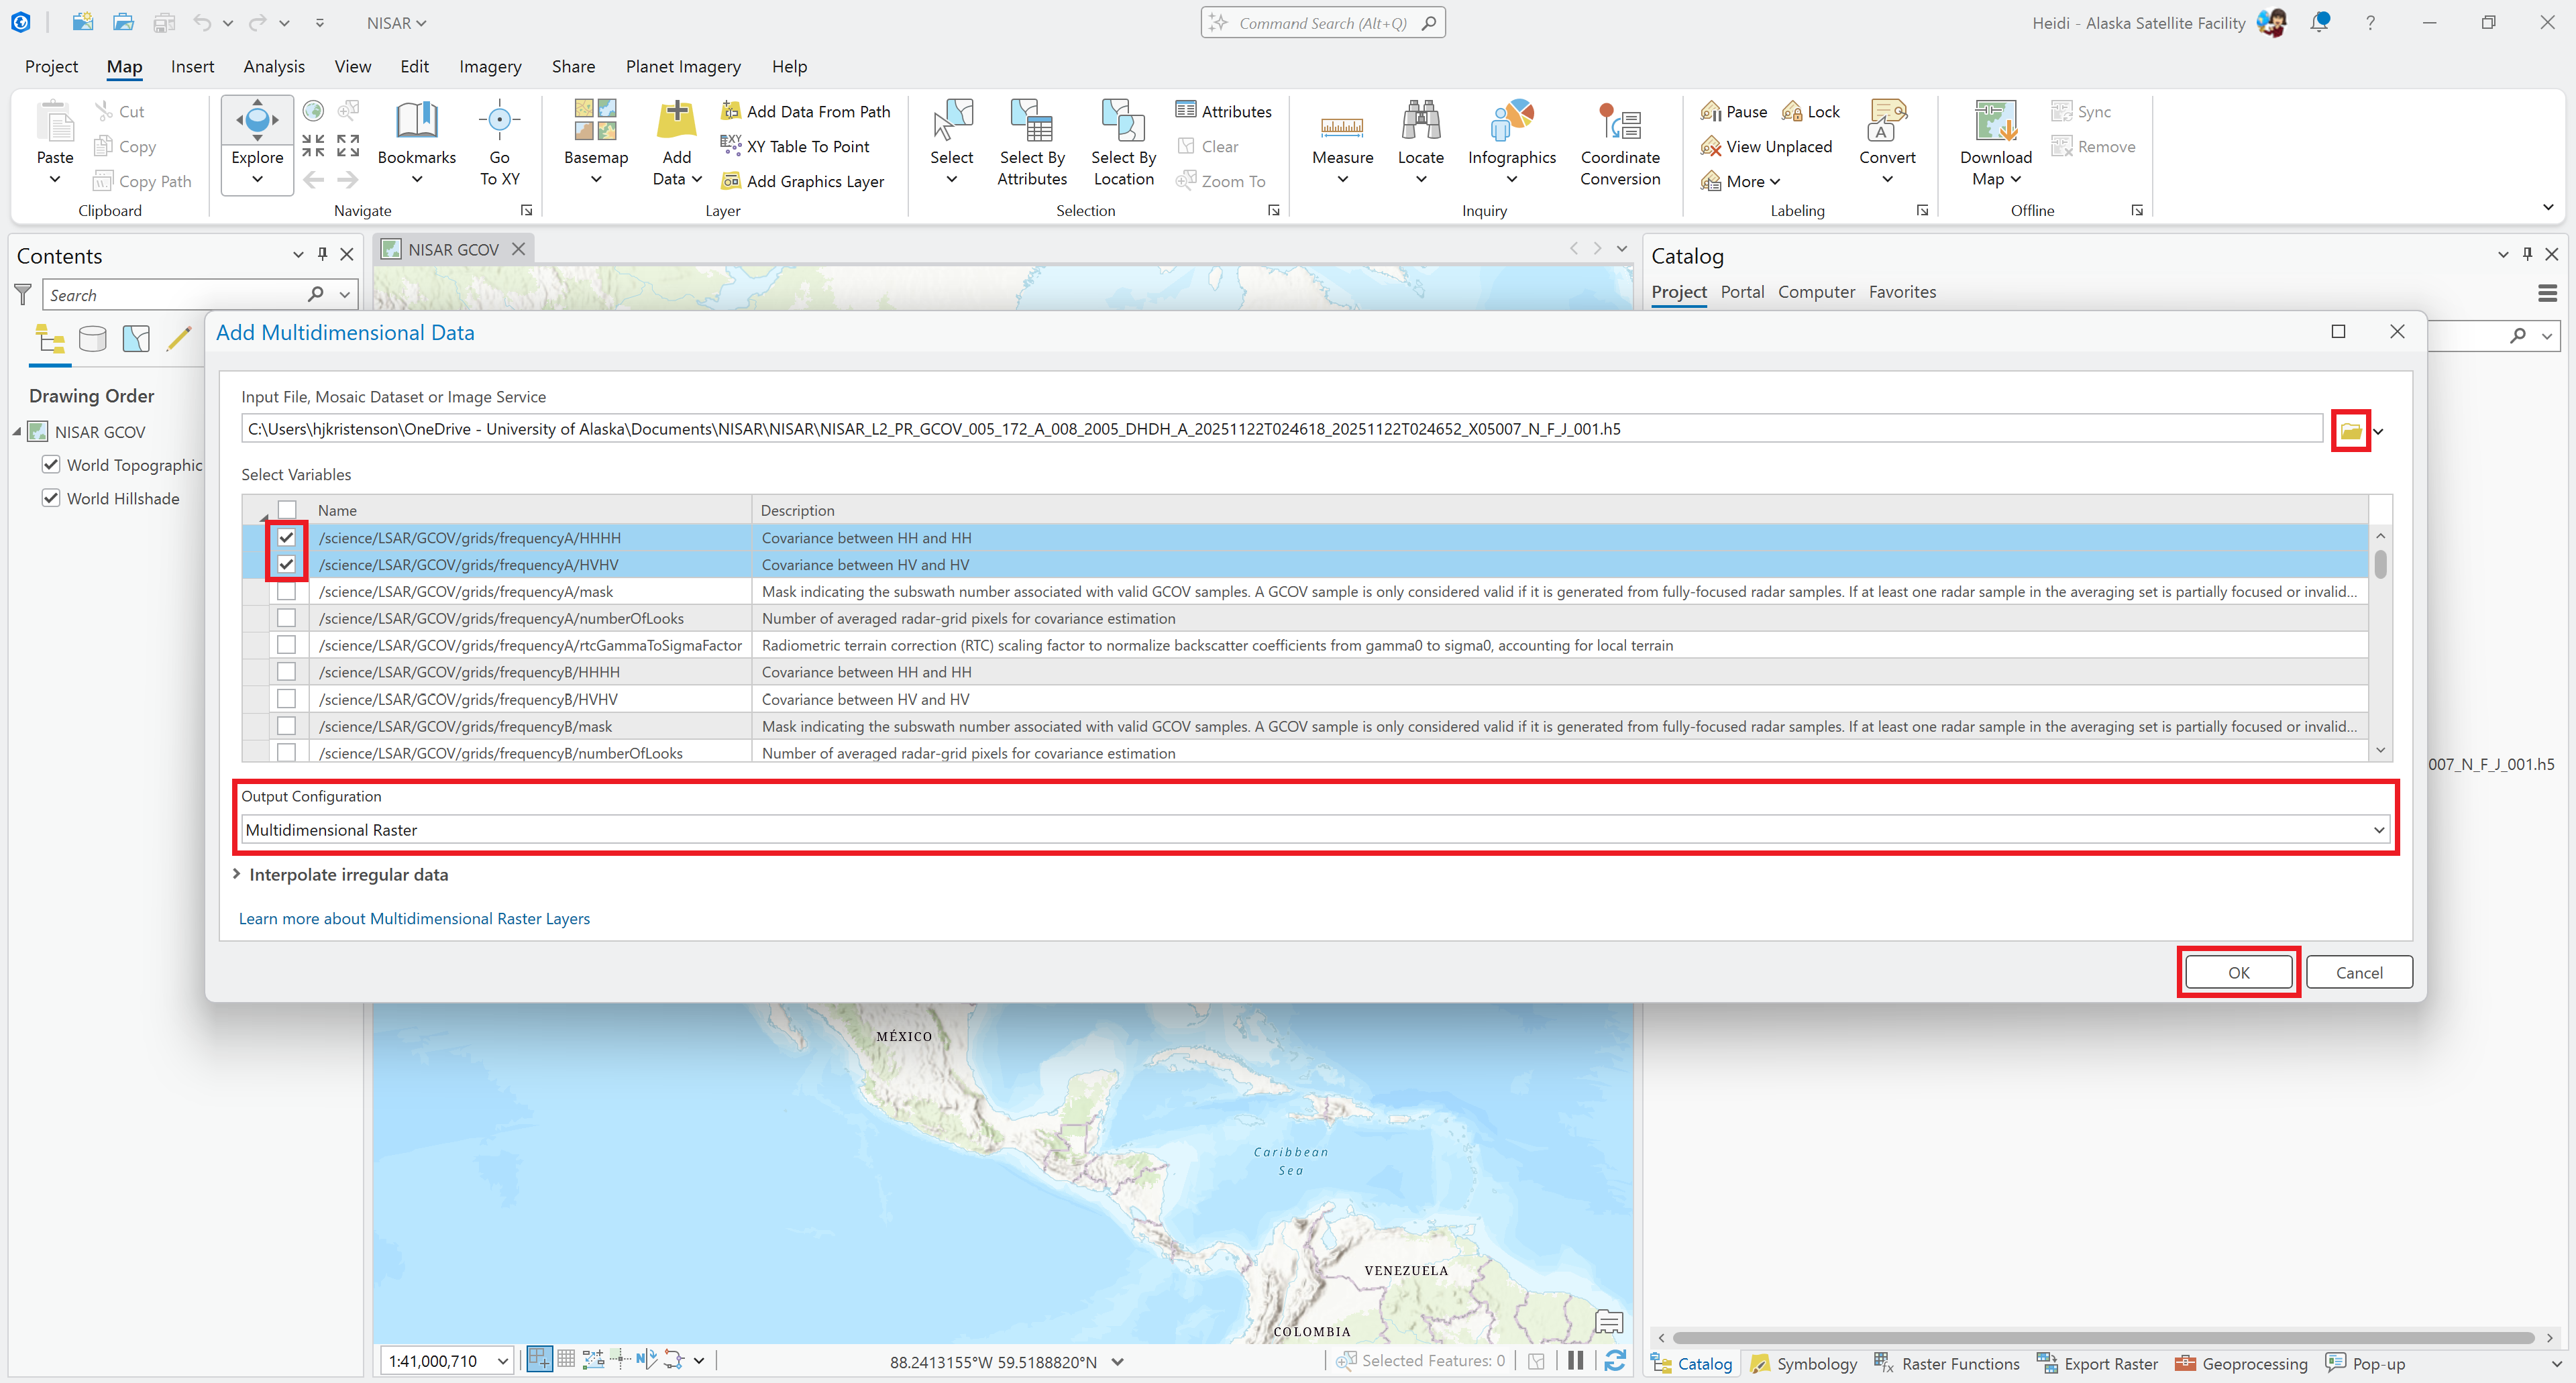
Figure 2:Select desired variables from a NISAR file to add them as individual layers to the map.
The Multidimensional Raster output configuration is the best choice for adding most variables to the map as individual layers. However, to add complex-valued variables, such as wrapped interferograms, you will need to select Multiband Raster as the output format in order to access both the amplitude and phase components of the dataset.
Drag and Drop
You can simply drag and drop the entire file from the Catalog pane. This approach is most useful when you want to export individual variables to other data formats before working with them in ArcGIS Pro.
The ability to adjust visualizations, use imagery tools, or perform analysis is limited when you add the entire HDF5 file to the map.
Add HDF5 File from Catalog Pane
Navigate to a NISAR HDF5 file in the Catalog pane
Drag the file onto the map area
Cancel the Calculating Statistics function
It is too time-consuming to run this function on the full HDF file; statistics can be calculated when a variable is extracted using the subset tool
By default, the first variable in the HDF5 file is displayed, and any changes to symbology are applied to all variables in the file.
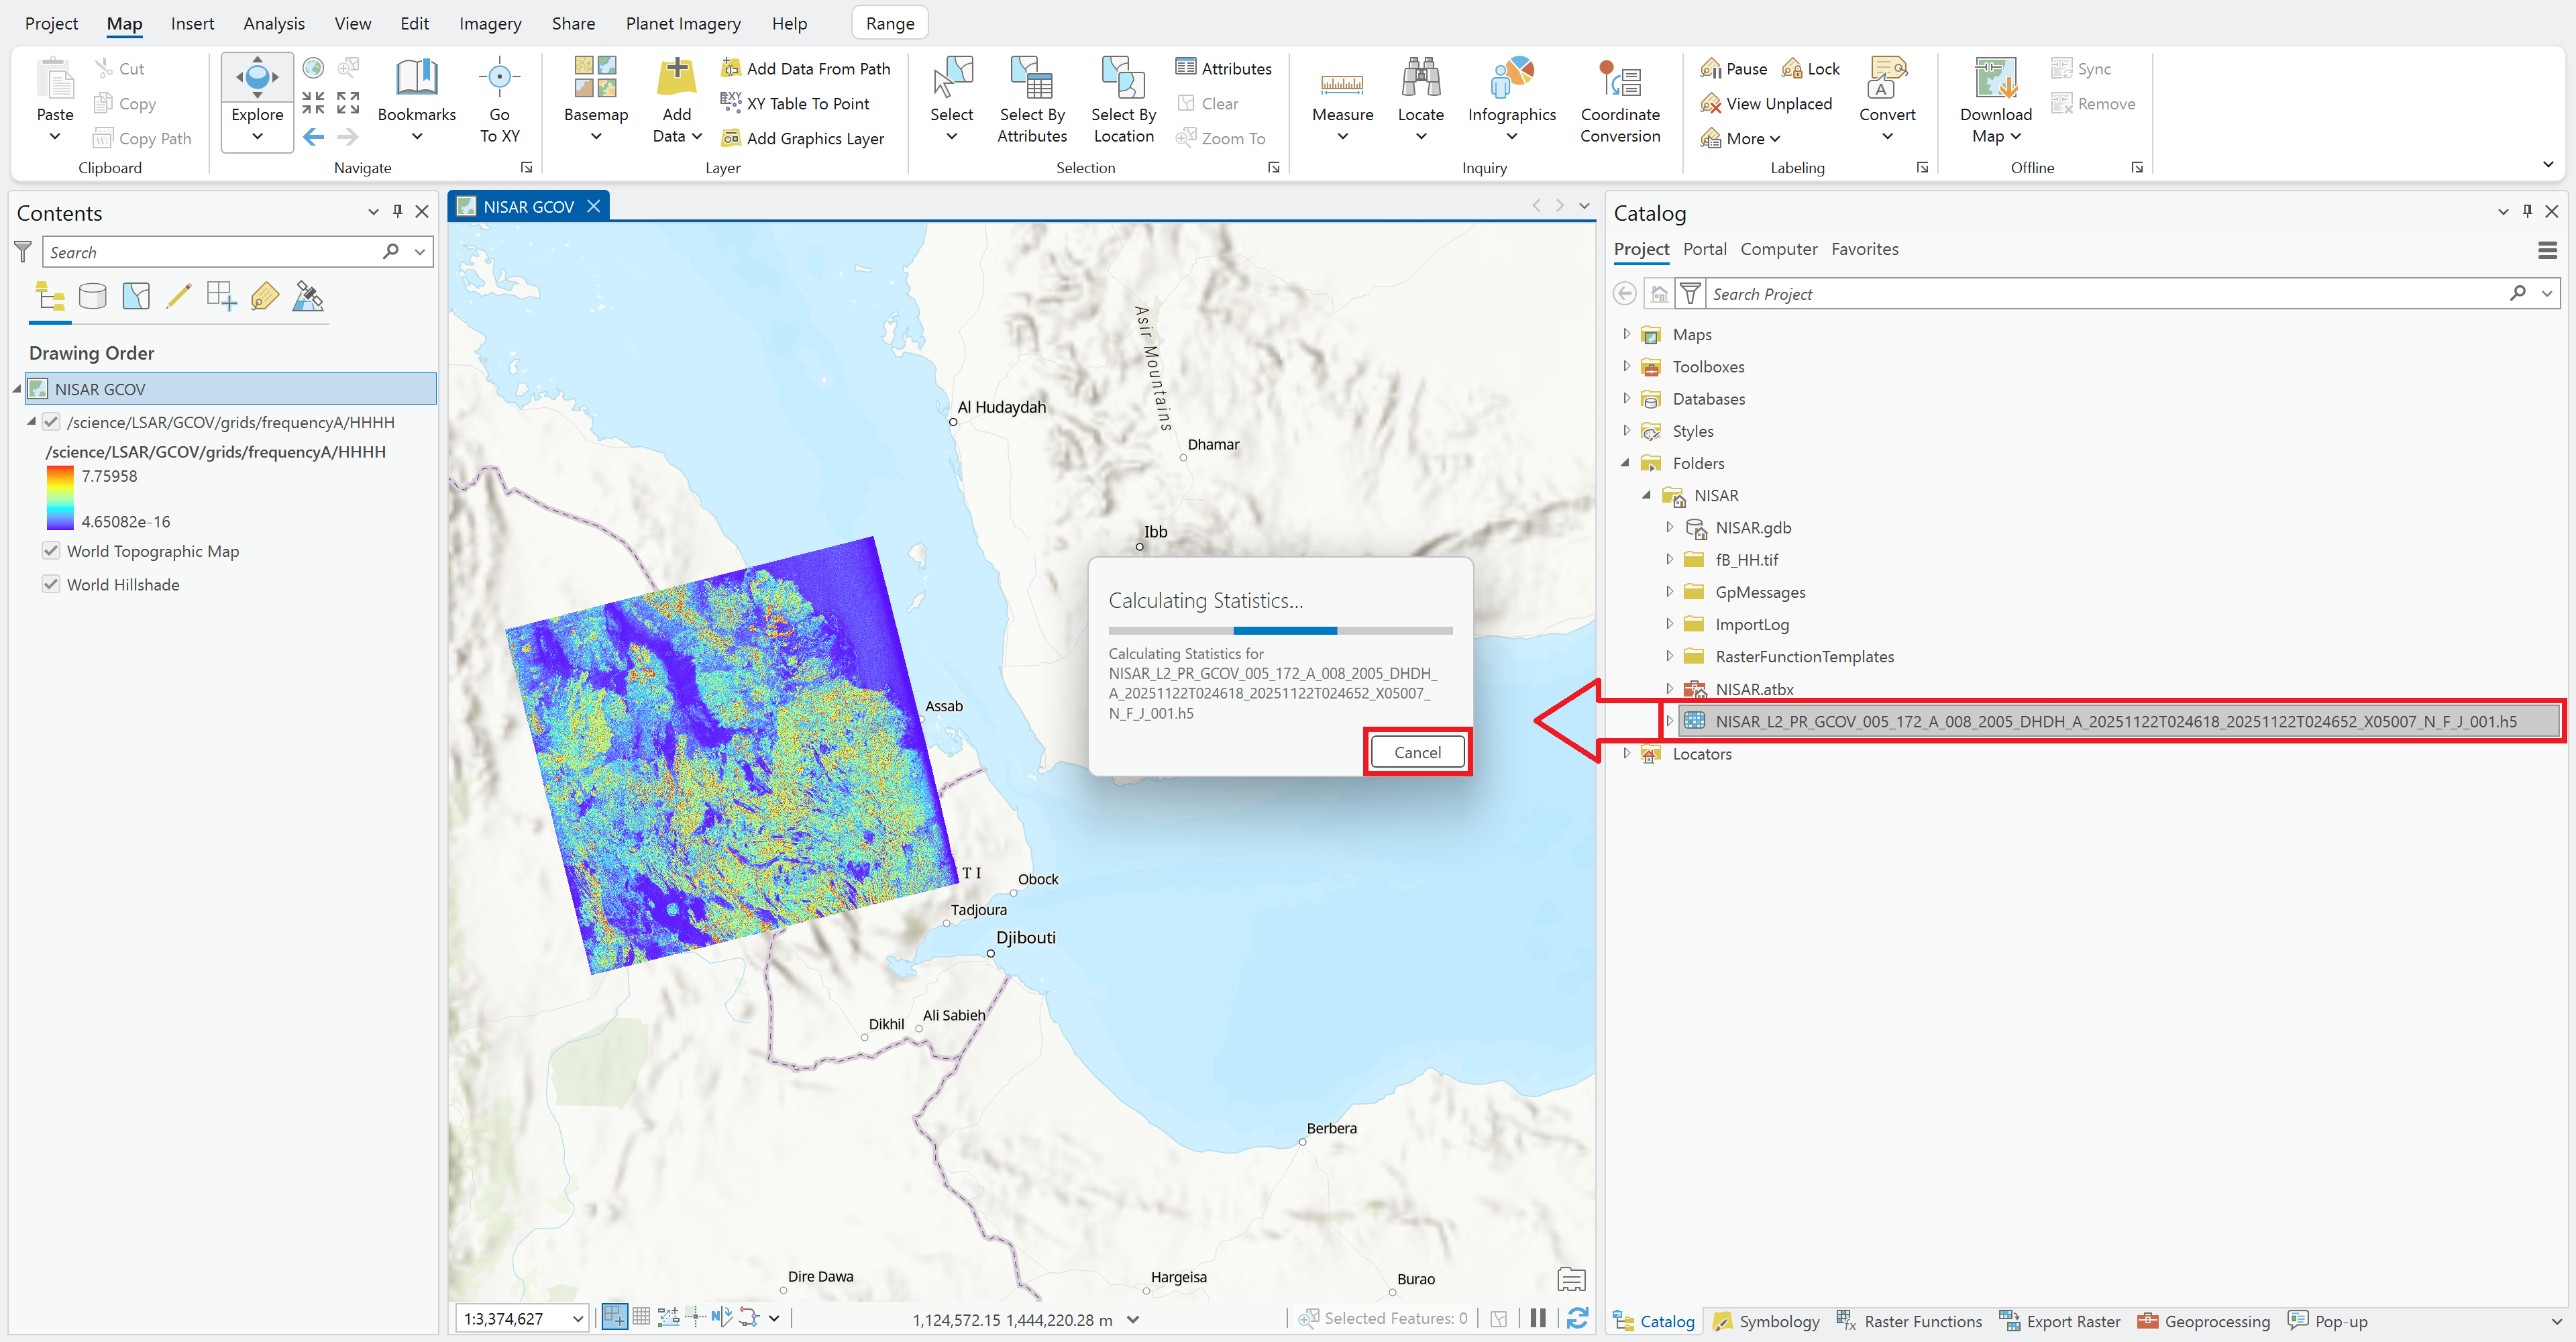
Figure 3:Using drag-and-drop functionality to add NISAR data to an ArcGIS Pro project.
Visualizing NISAR Data
Most NISAR data does not visualize well by default, and symbology adjustments need to be applied to view features of interest. Refer to the NISAR in GIS StoryMap to learn more about adjusting symbology for GCOV and GUNW product variables.
Symbology Settings
Symbology adjustments can be made for NISAR variables as you would any other layer. Right-click the layer and select Symbology to open the Symbology panel.
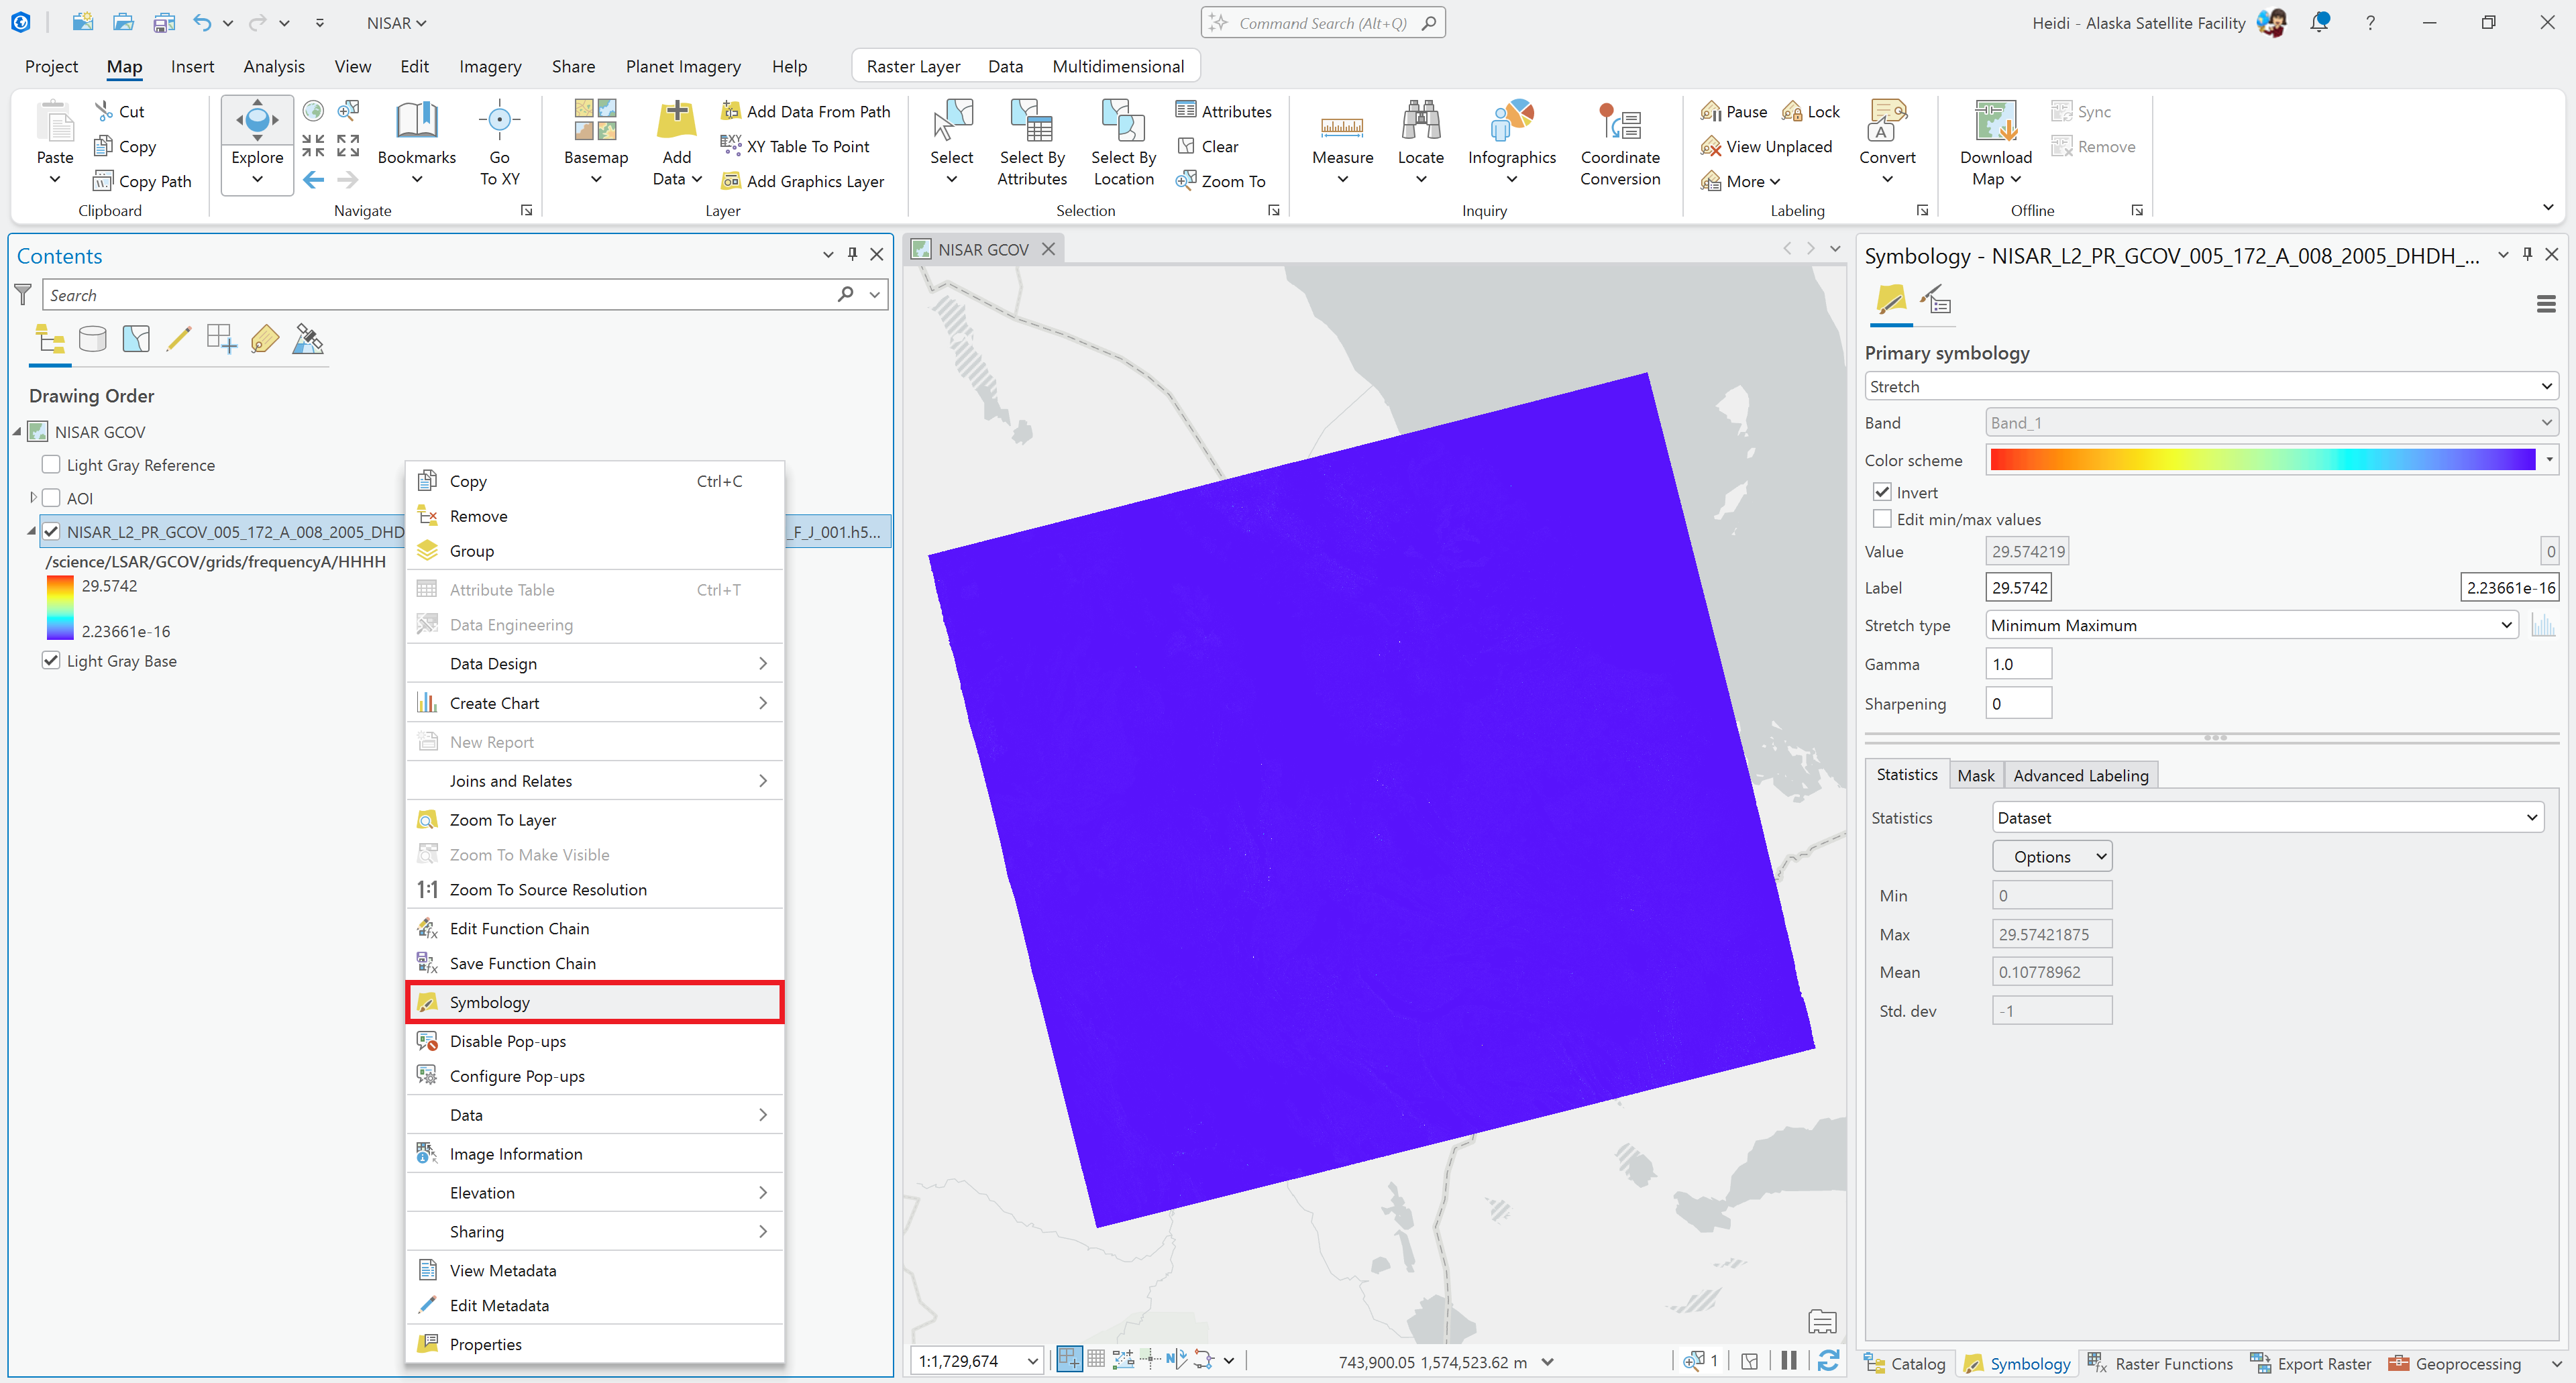
Figure 4:Right-click a layer and select Symbology to open the Symbology settings pane.
By default, ArcGIS displays NISAR variables using the Spectrum - Full Bright color scheme. SAR backscatter is traditionally displayed in grayscale, with lower values appearing darker than higher values, but you can apply whatever color scheme you prefer. If you do want to use the traditional grayscale rendering, make sure that the Invert check-box is cleared.
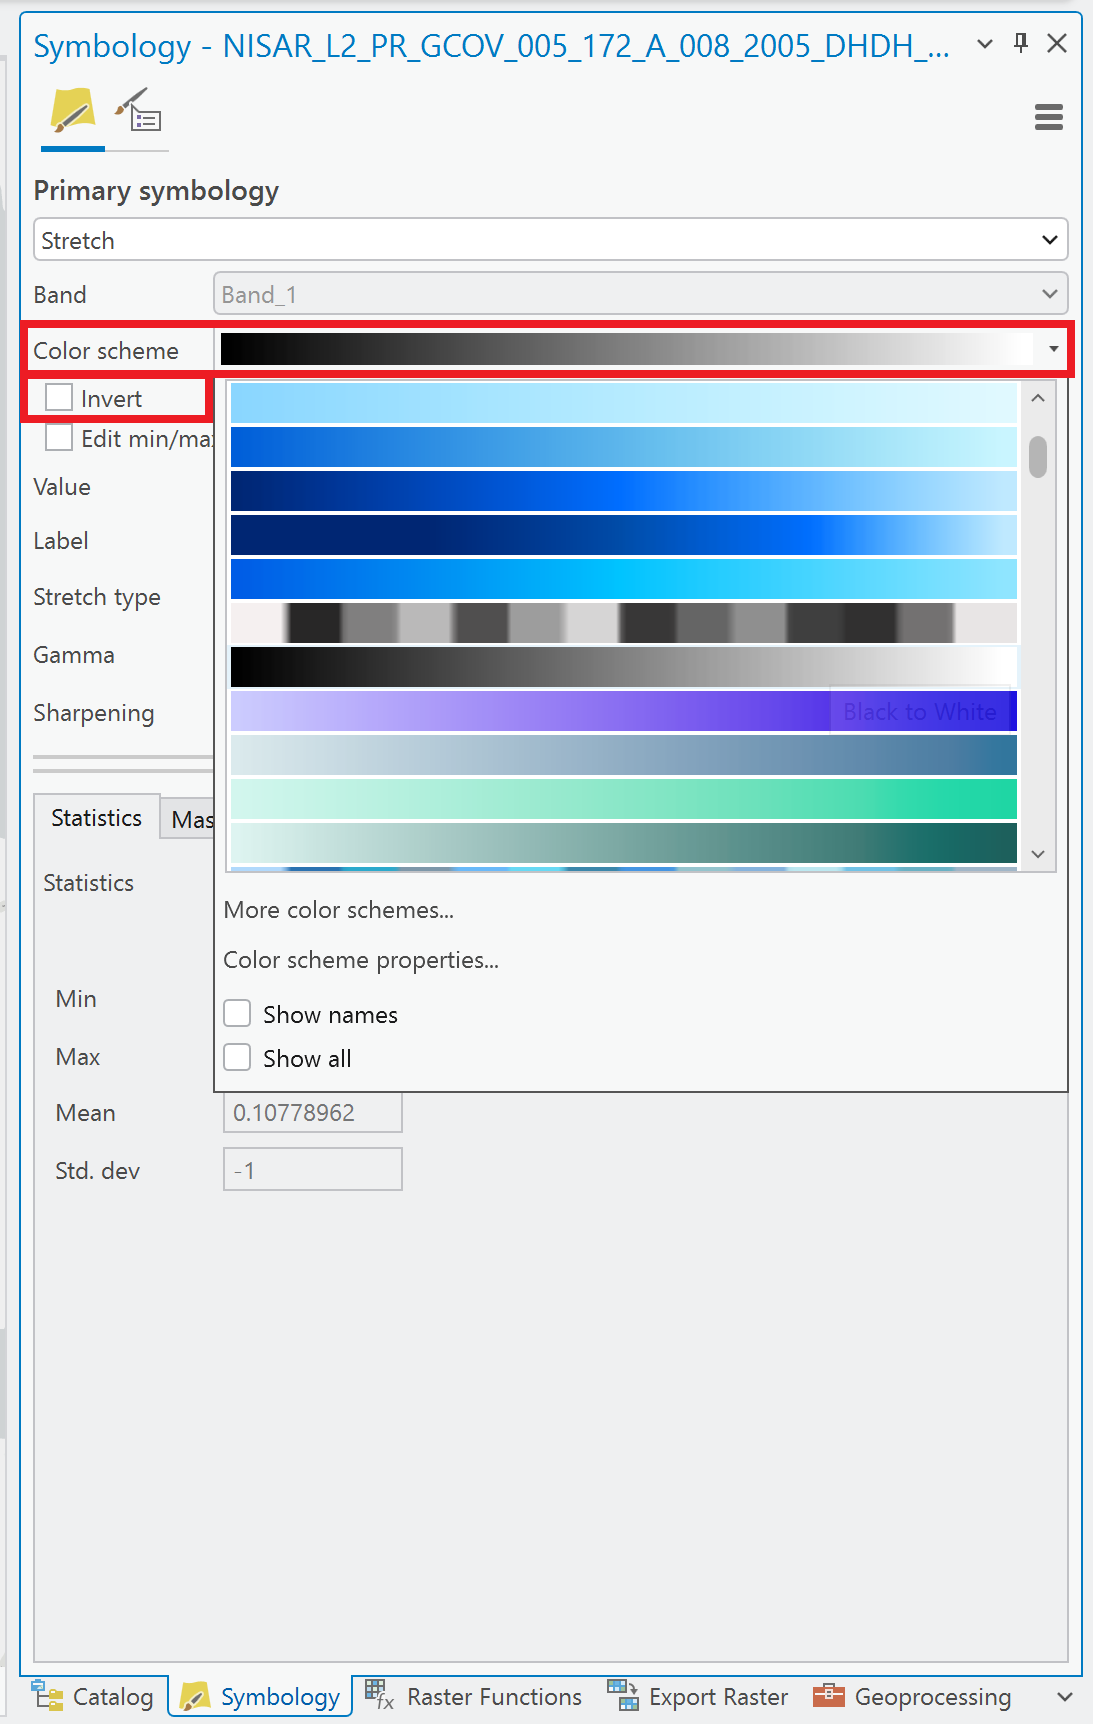
Figure 5:Change the color scheme for the layer. To use a traditional grayscale scheme, clear the check next to Invert when selecting the Black-to-White color scheme.
Viewing Amplitude Data
When viewing amplitude data, the images tend to appear very dark when using the default symbology. Because most backscatter values are very close to 0, it’s helpful to change the stretch settings to focus on the range of the majority of the pixel values.
One way to quickly render a view of the landscape is to apply a Standard Deviation stretch using Dynamic Range Adjustment (DRA).
Set the Stretch type to Standard Deviation. In the Statistics tab, set Statistics to DRA. You may want adjust the number of standard deviations to see what works best for your particular area. Values between 1 and 2 are often suitable for backscatter.
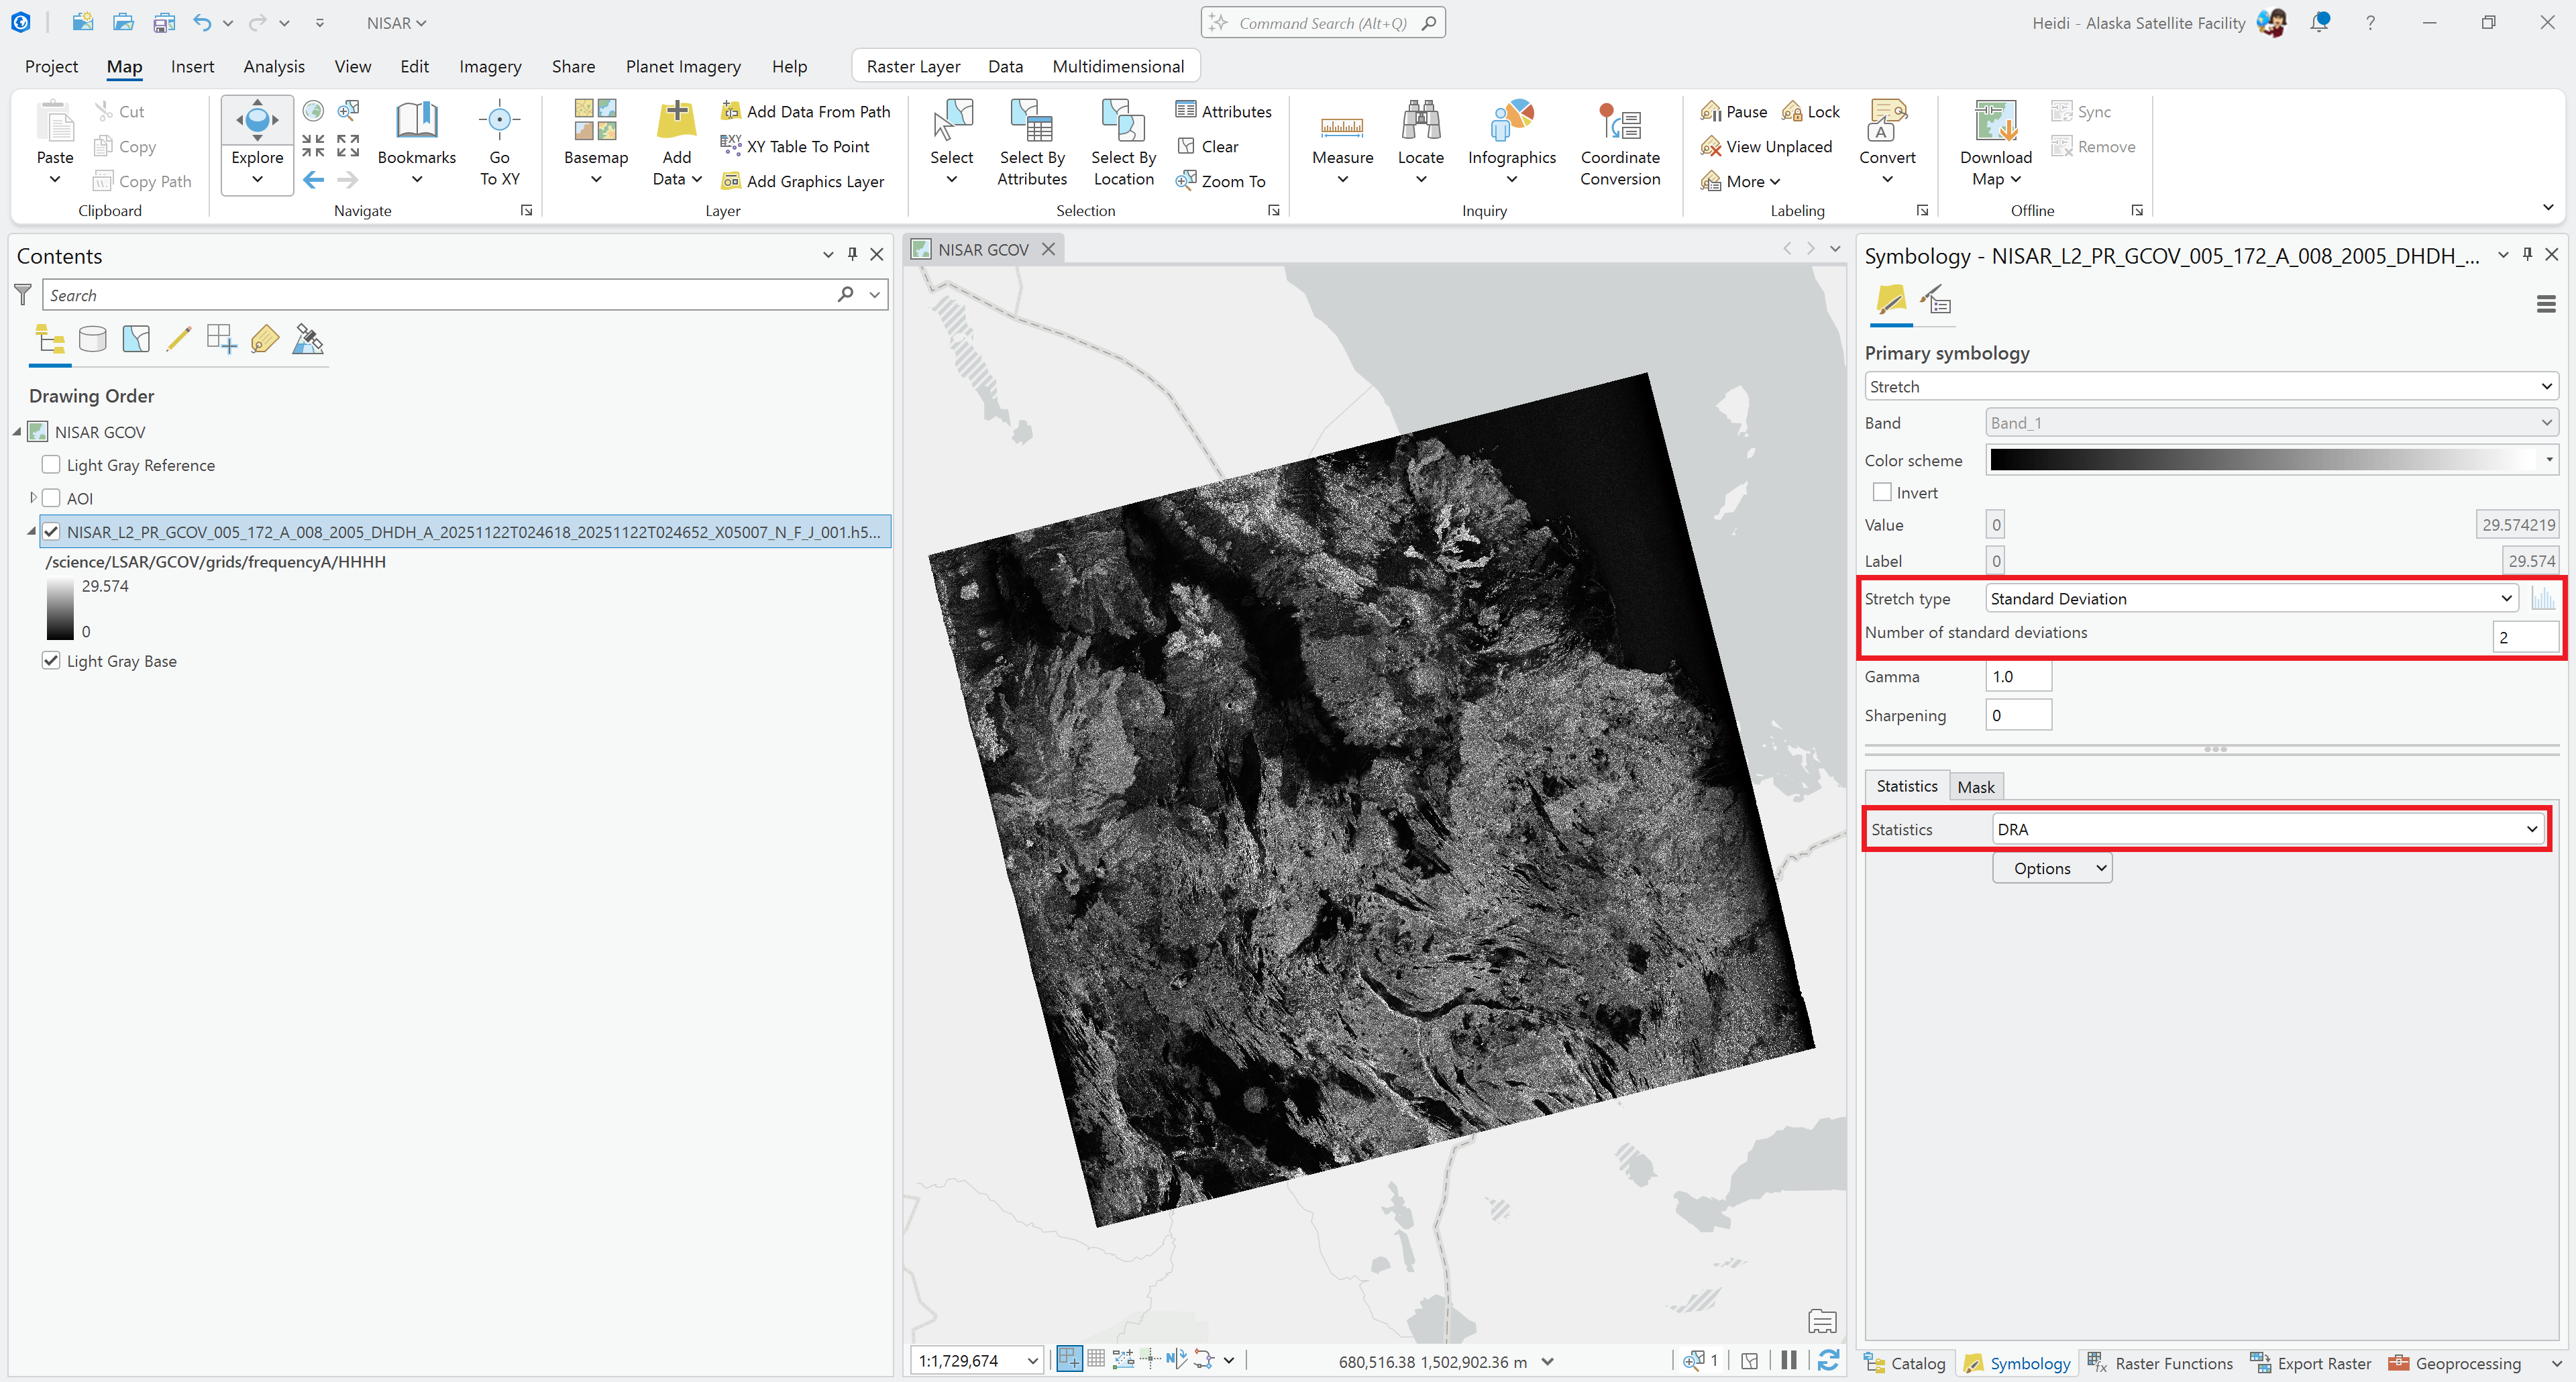
Figure 6:Set the Stretch type to Standard Deviation, and set the Statistics type to DRA in the Statistics tab.
Another option is to set a custom Minimum-Maximum value range. Experiment to find the values that work best to view the features you want to see in your area of interest. Keep in mind that cross-pol (HV or VH) backscatter values tend to be lower than co-pol (HH or VV) returns, so you may need to use different ranges depending on the polarization.
Change the Stretch setting to Minimum-Maximum if necessary. In the Statistics tab, set Statistics to Custom, and enter the desired Min and Max values.
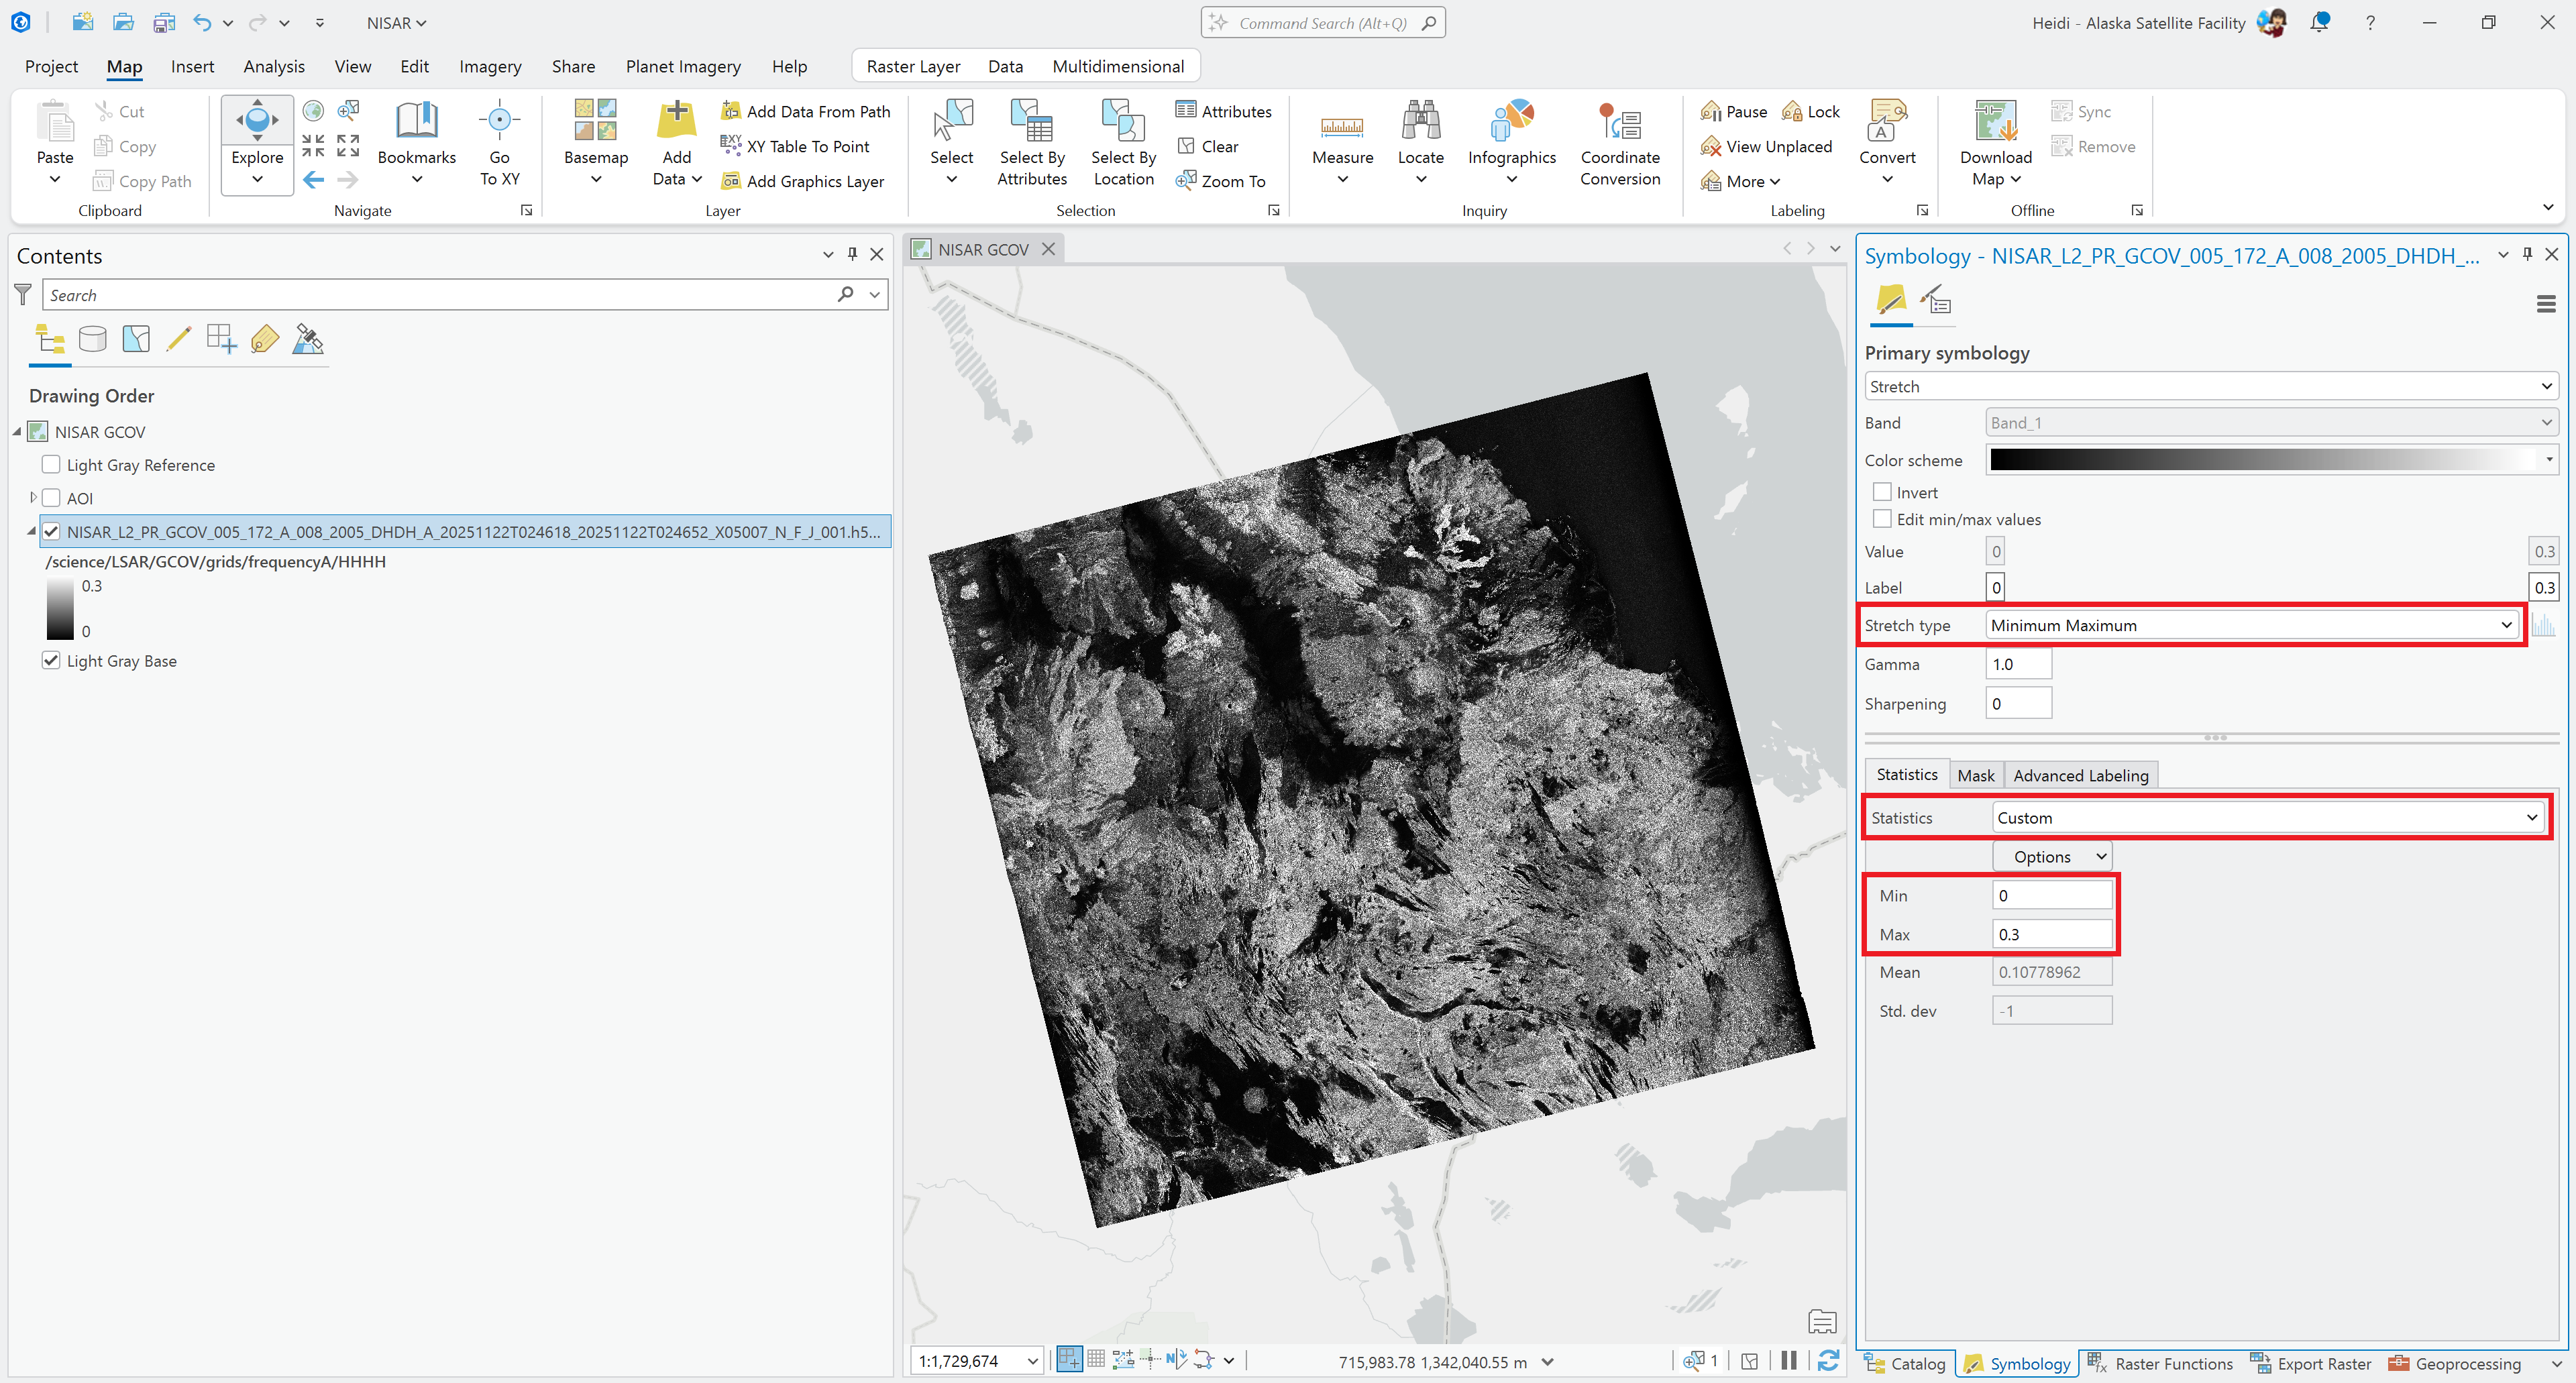
Figure 7:For the Minimum-Maximum stretch, set the Statistics type to Custom, and enter the desired pixel values for Min and Max.
Viewing Coherence Data
The Coherence variables included in the GUNW products are traditionally displayed in grayscale, and stretched from 0 to 1. You can use whatever color scheme you prefer, but by using the Minimum-Maximum Stretch type and setting the Min and Max values to 0 and 1, you can render a consistent visualization across products, regardless of the range of actual values represented in each different coherence layer.
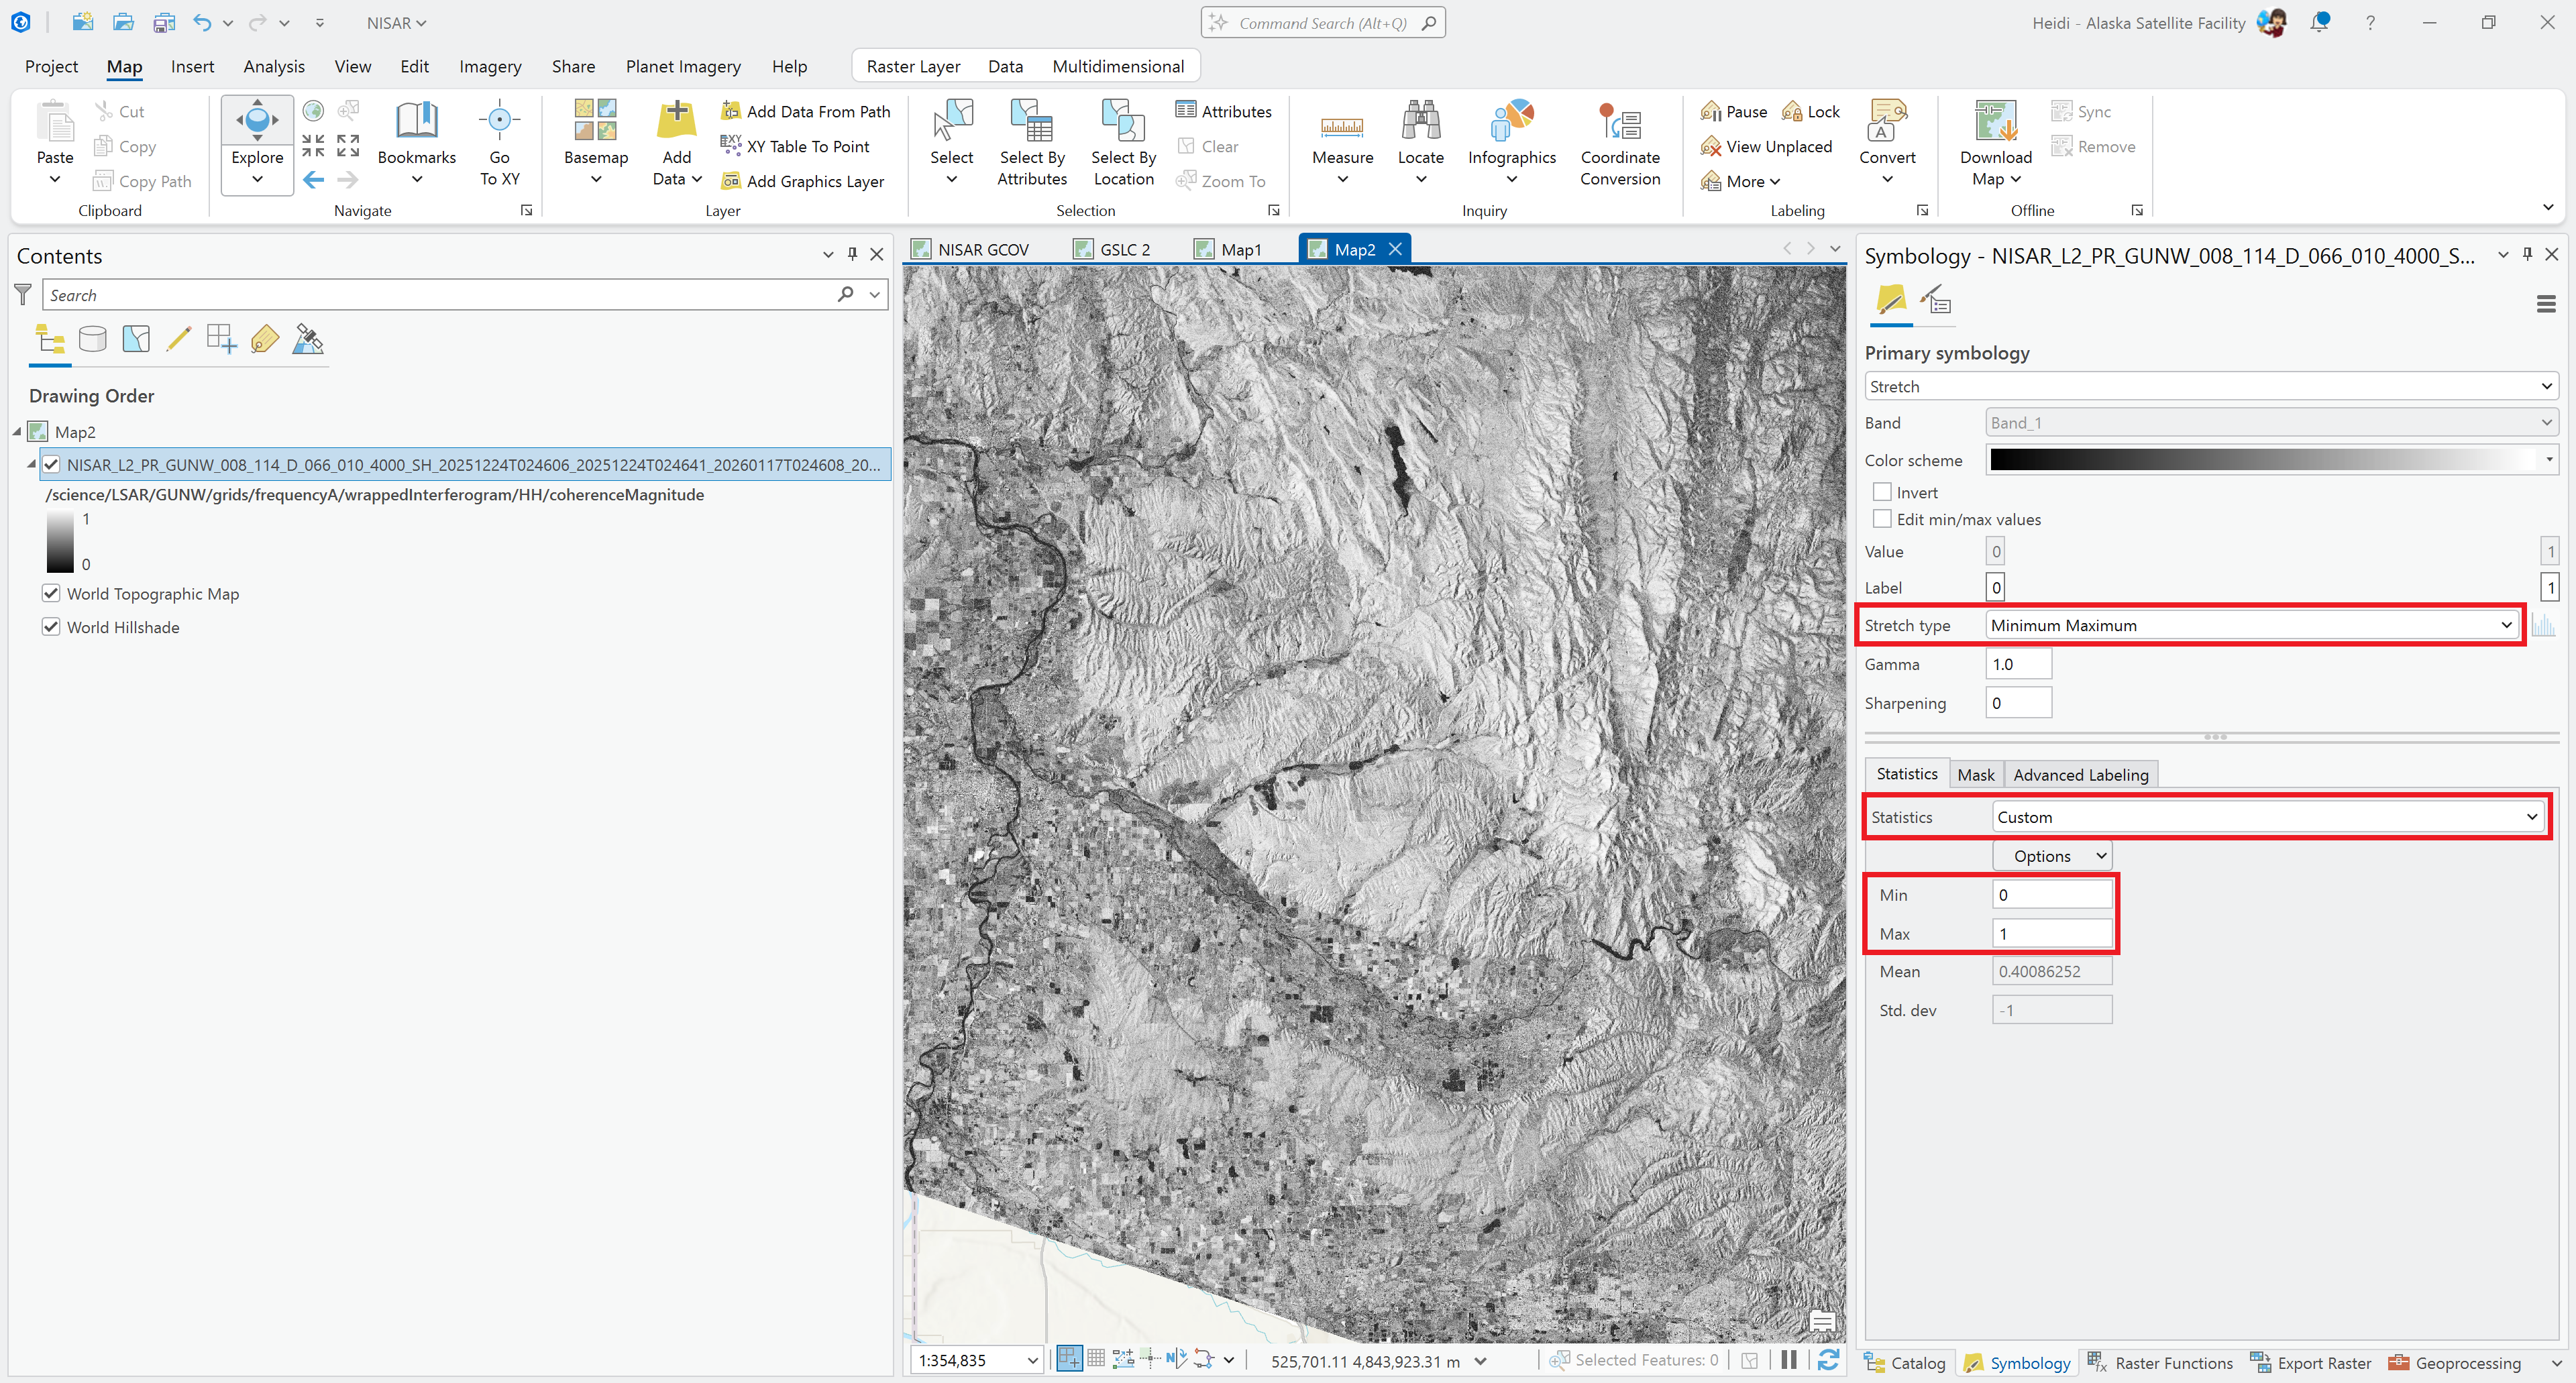
Figure 8:To include the full range of potential coherence values, use a Minimum-Maximum Stretch type and set the Statistics type to Custom with a Min value of 0 and a Max value of 1.
Maintaining Symbology Settings
Sometimes connections to the source HDF5 variable are broken, and symbology settings may not be preserved even if you use the Set Data Source dialog in the layer properties (under the Source tab) to re-set the variable path.
If you make symbology changes to a NISAR variable and you want them to persist, consider exporting the variable as a stand-alone raster first, which provides a more stable source for ArcGIS projects. It also allows you to save the data as a layer, including the symbology settings, for use in other projects.
Transforming NISAR Data
There are many reasons for transforming NISAR variables. You may prefer working with a particular raster file format, require a different coordinate system or projection, need to resample the data to match another dataset, or want to subset the dataset spatially to make analysis more manageable.
There are a number of approaches for transforming NISAR variables in ArcGIS Pro. The Subset Multidimensional Raster Tool and the Export Raster function are well suited for use with NISAR data. Both methods provide the ability to apply multiple transformations at the same time.
Subset Multidimensional Raster Tool
To extract variables from an HDF5 file, you can use the Subset tool in the Data Management menu to save individual variables to a stand-alone raster format.
This tool can be used either with a full HDF5 layer that was added to the project using the Drag and Drop method, or with individual layers added using the Add Multidimensional Raster Tool interface.
Click on an HDF5 layer or an individual variable layer in the Contents pane
Click on the Multidimensional menu tab
Click the Data Management button
Select Subset to open the Subset Multidimensional Raster tool
Edit the Output Multidimensional Raster field to enter the desired filename
The default output format is Cloud Raster Format (CRF), but you can simply type
.tifas the file extension to output the variable as a GeoTIFF
If working with a full HDF5 layer, check the box next to the desired variable to export
If you’ve referenced an individual variable layer, only that one variable will be listed, and is checked by default
If you want to export the variable using the default environment settings, click the OK button to export the variable
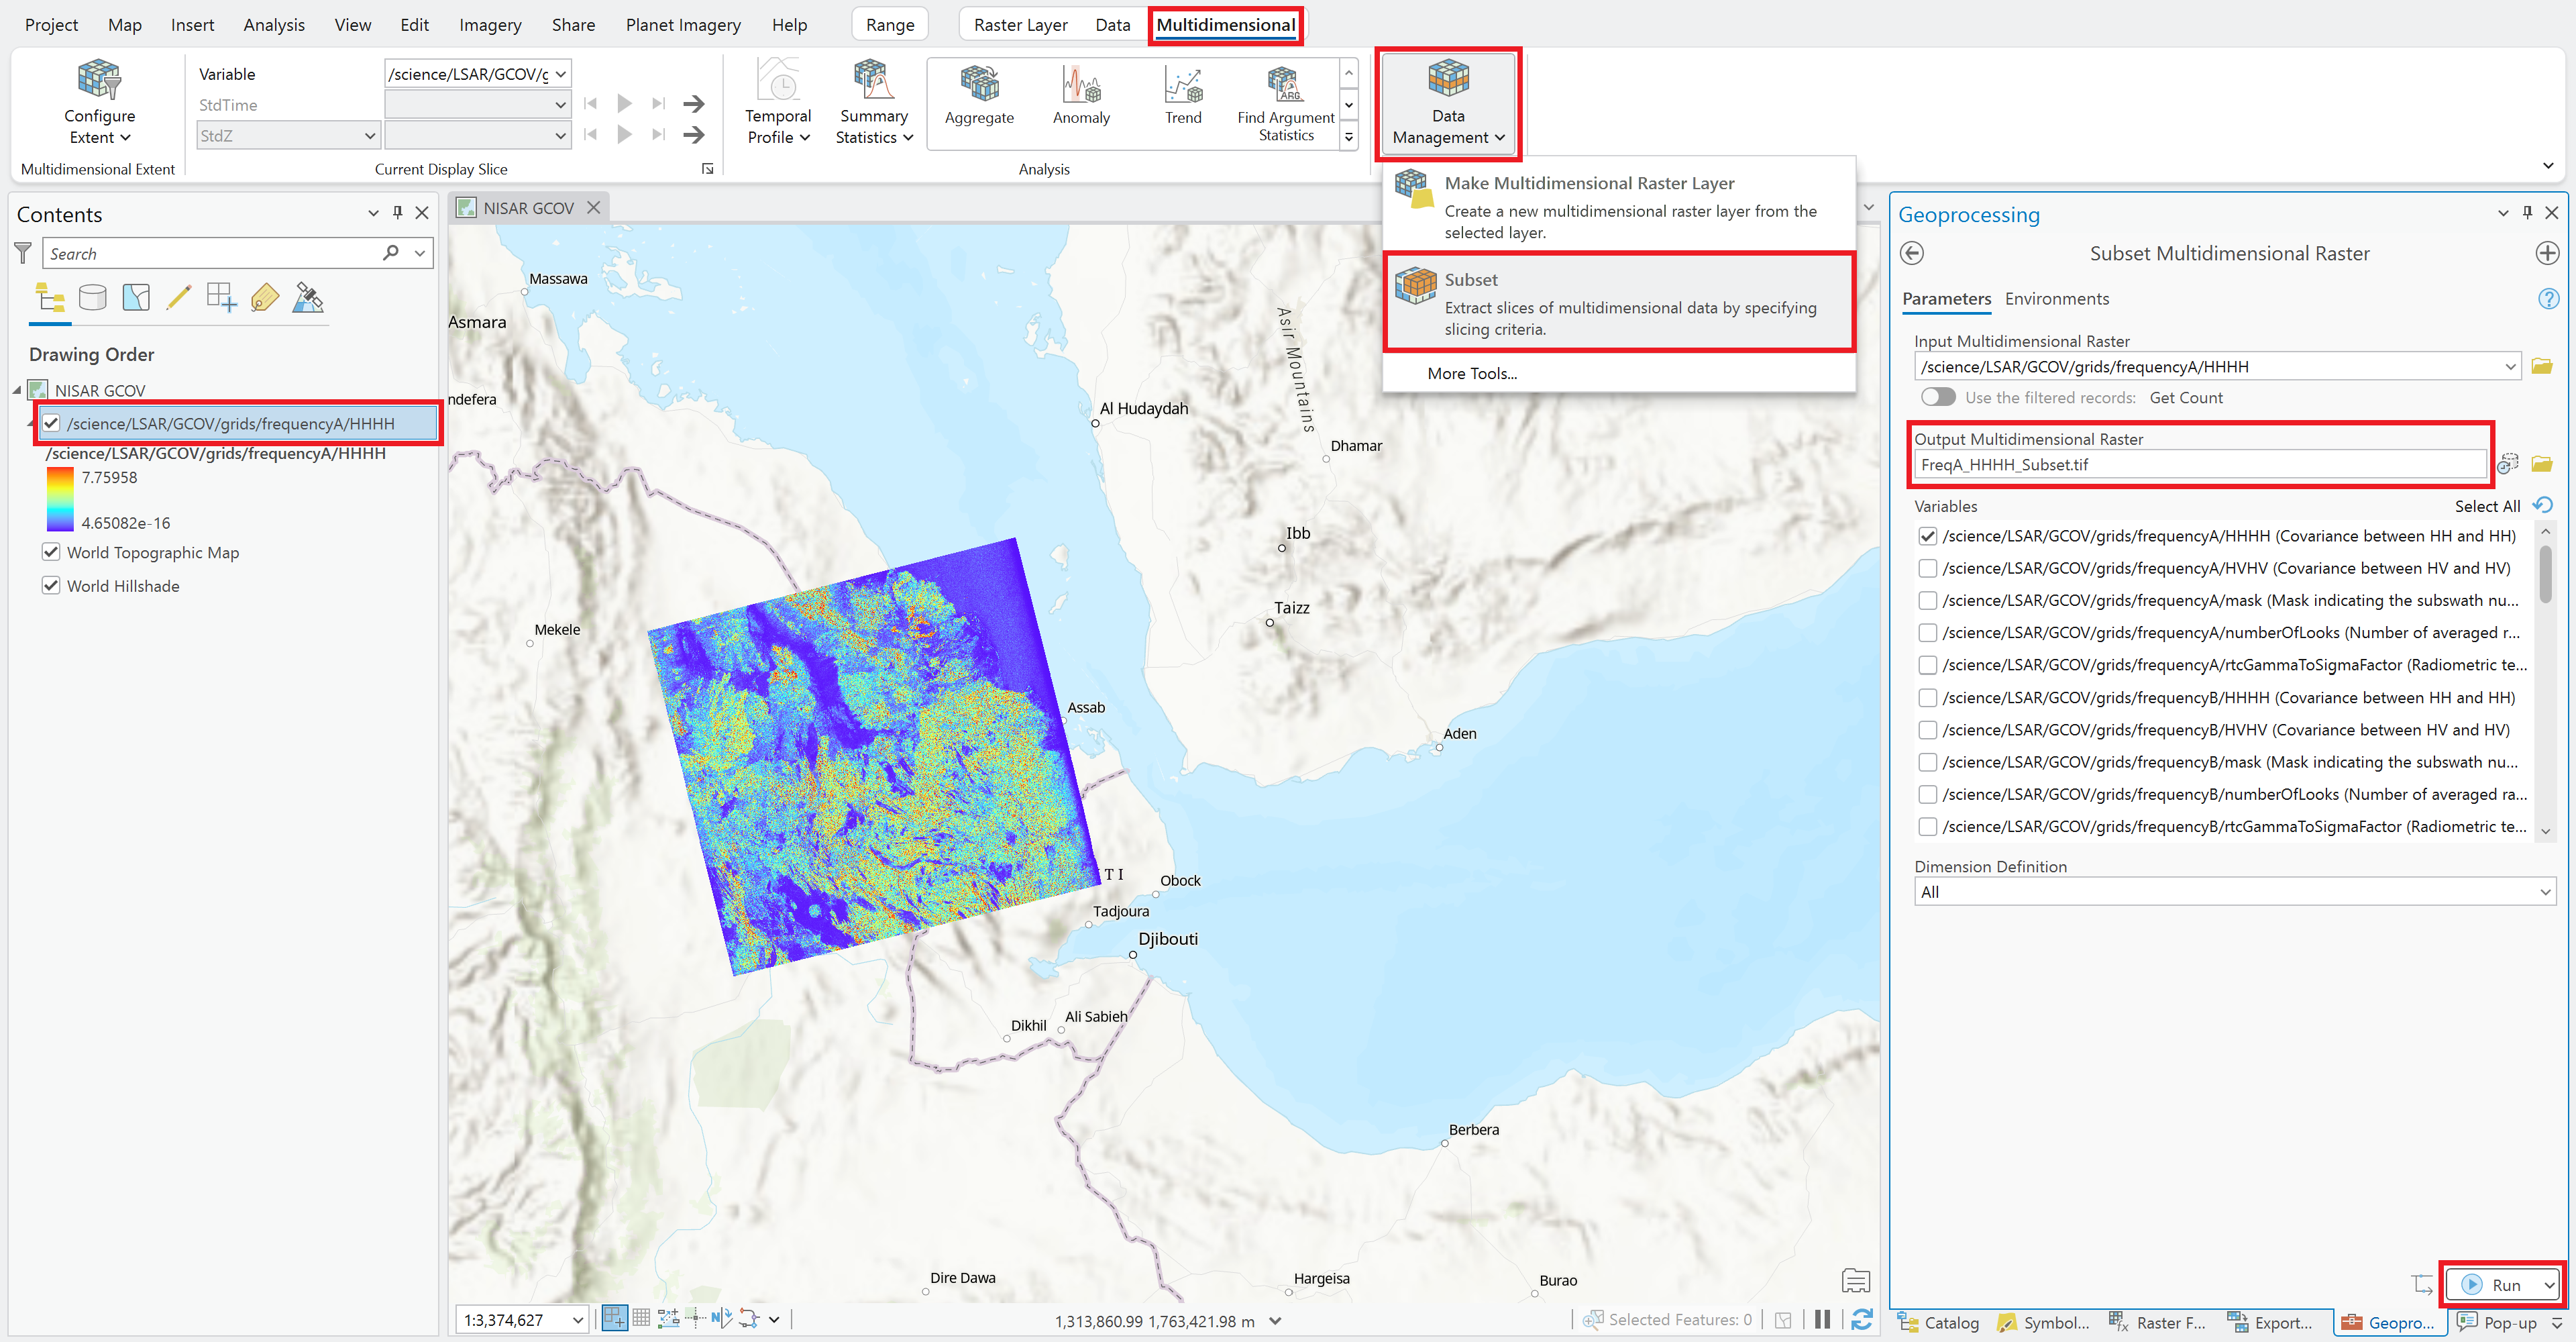
Figure 9:Using the Subset tool to extract variables from an HDF5 file added to ArcGIS Pro using the Drag-and-Drop method.
Environment Settings
The Environment tab of the Subset Multidimensional Raster Geoprocessing dialog provides a convenient interface for applying dataset transformations as a variable is being extracted.
You can output the variable with a different coordinate system, apply spatial subsetting, change the pixel size, or adjust the raster storage characteristics (pyramid behavior, statistic calculation approach, compression, resampling method).
Spatial Subsetting
To extract a spatial subset of the variable using the subset tool:
Click on the Environments tab
Set the processing extent using one of the available options indicated by the icons, including:
Use the current map extent
Manually draw an extent on the map (as illustrated in Figure 10)
Use the extent of a layer in the map
Use the extent of a saved geospatial file
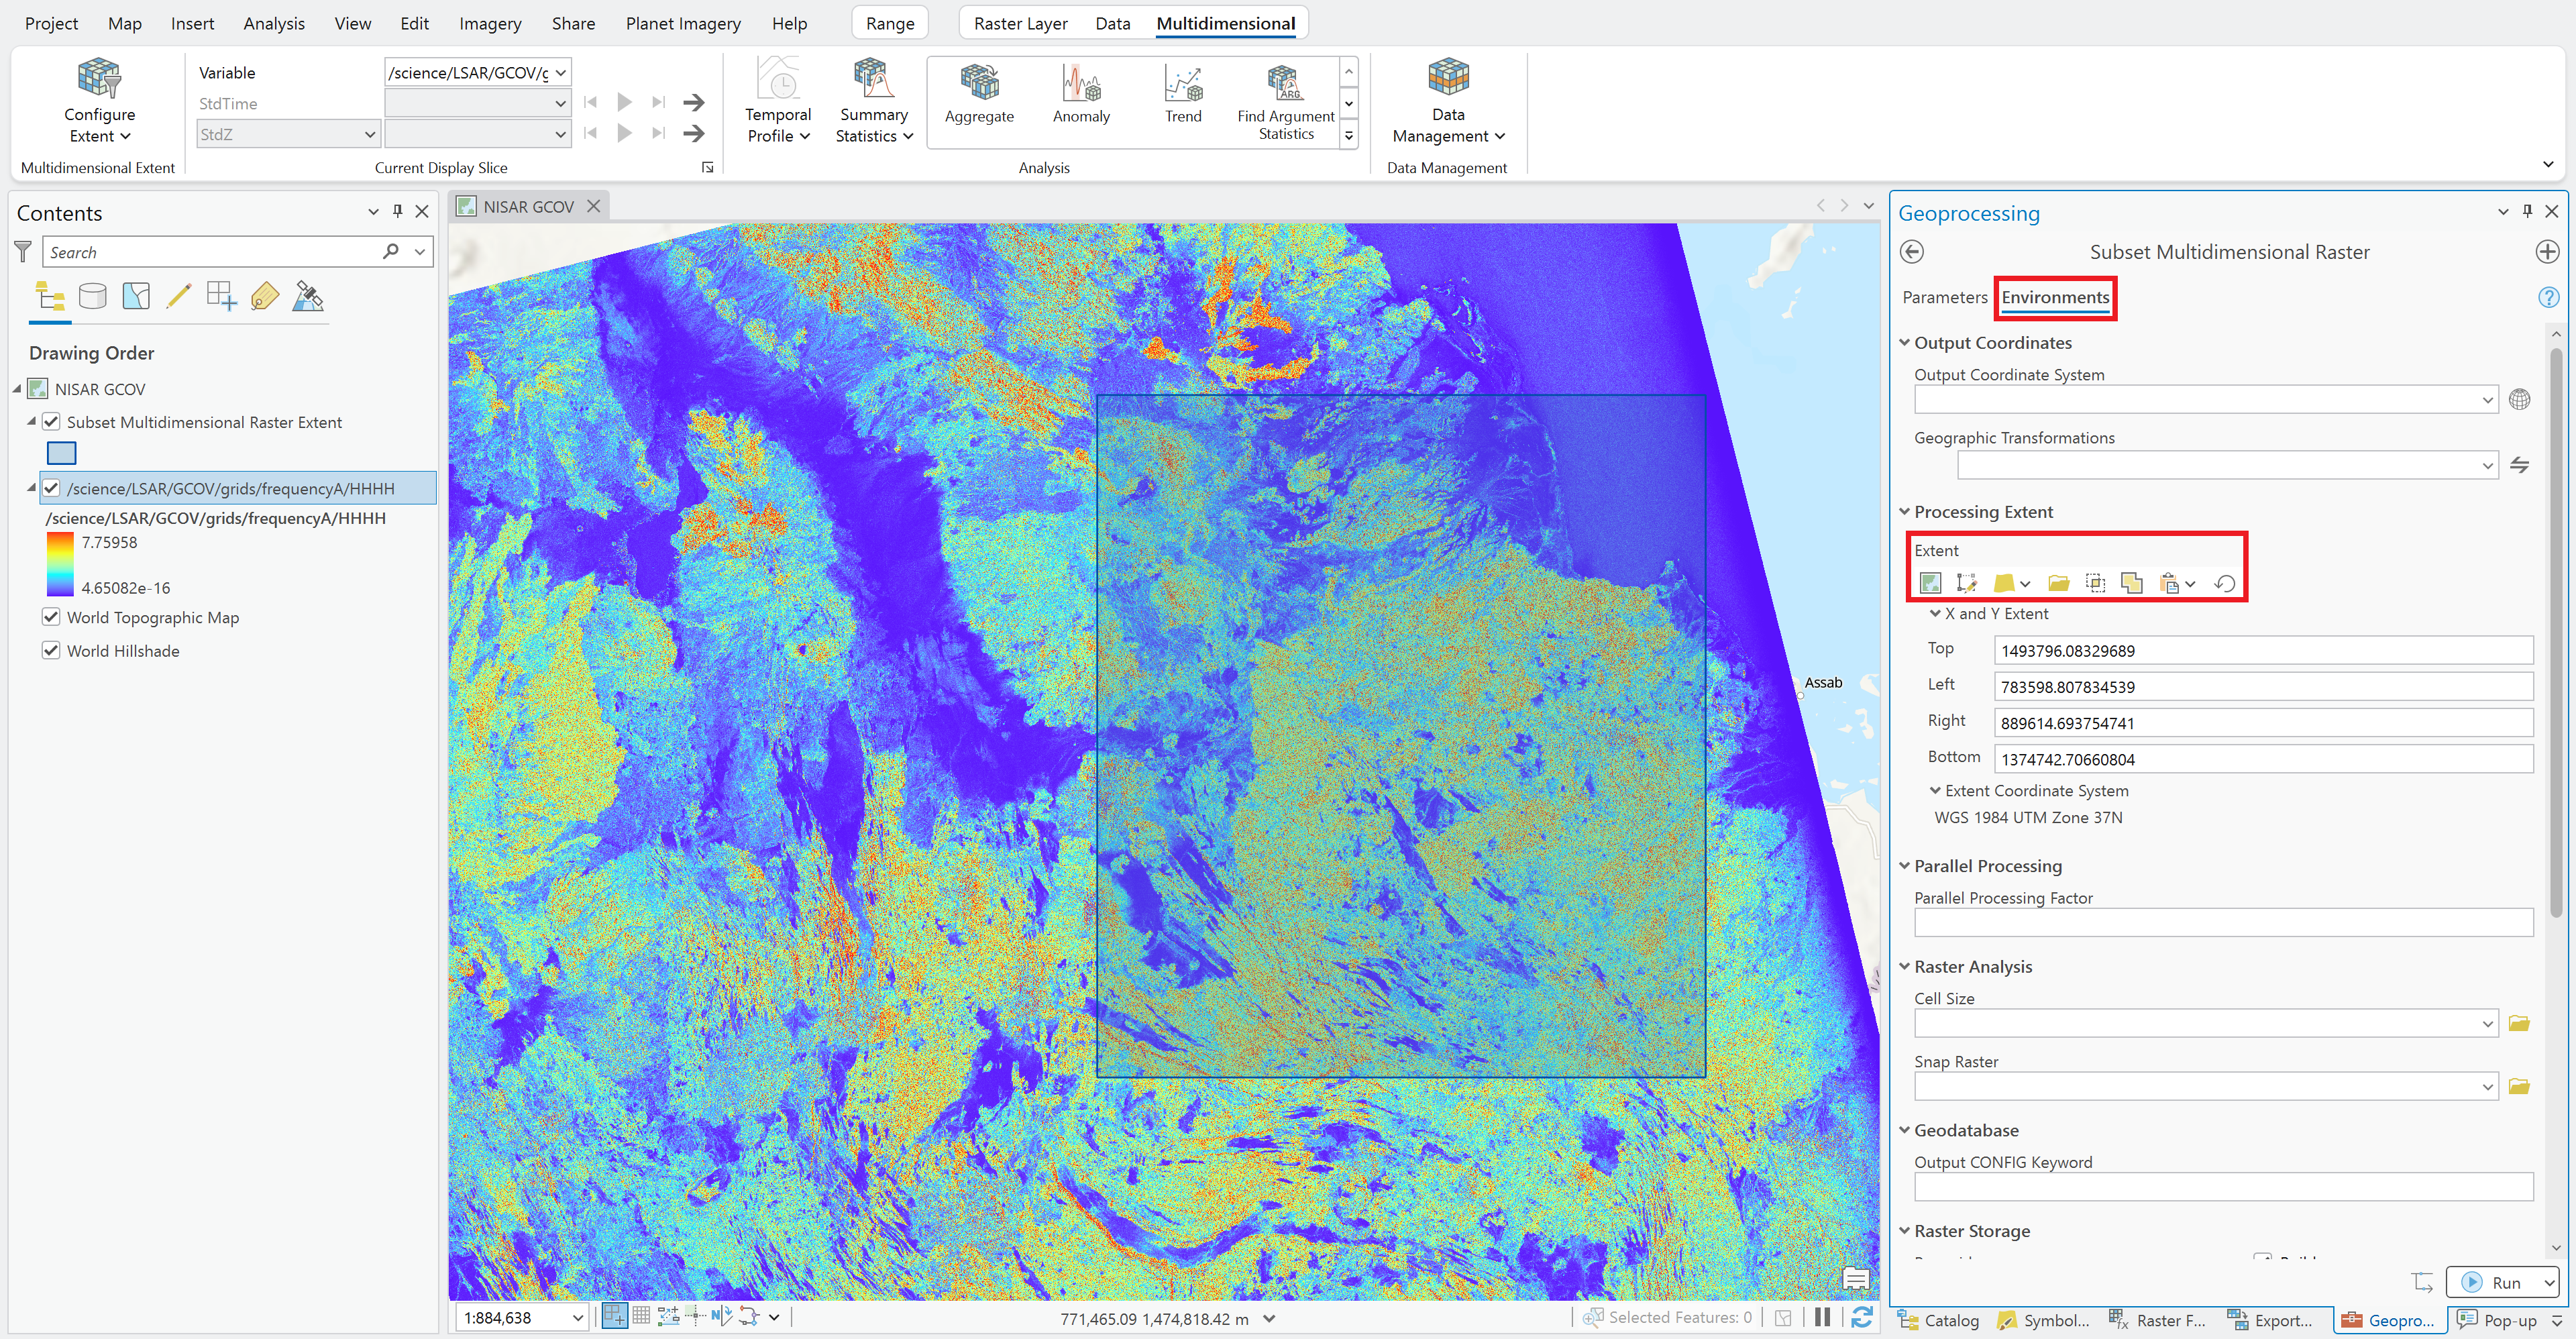
Figure 10:Setting the Environment variables in the Subset tool to apply a spatial extent to variables extracted from an HDF5 file added to ArcGIS Pro using the Drag-and-Drop method.
Once you’ve adjusted the settings in the Environments tab, return to the Parameters tab to verify that all other settings are correct before clicking the OK button to export the variable to a stand-alone raster format.
Export Raster
To export an HDF5 variable added as an individual layer using the Add Multidimensional Raster Tool, you can simply use the Export Raster function. Access this function using one of these methods:
Right-click the layer in the Contents pane, select Data from the menu, and click Export Raster (Figure 11)
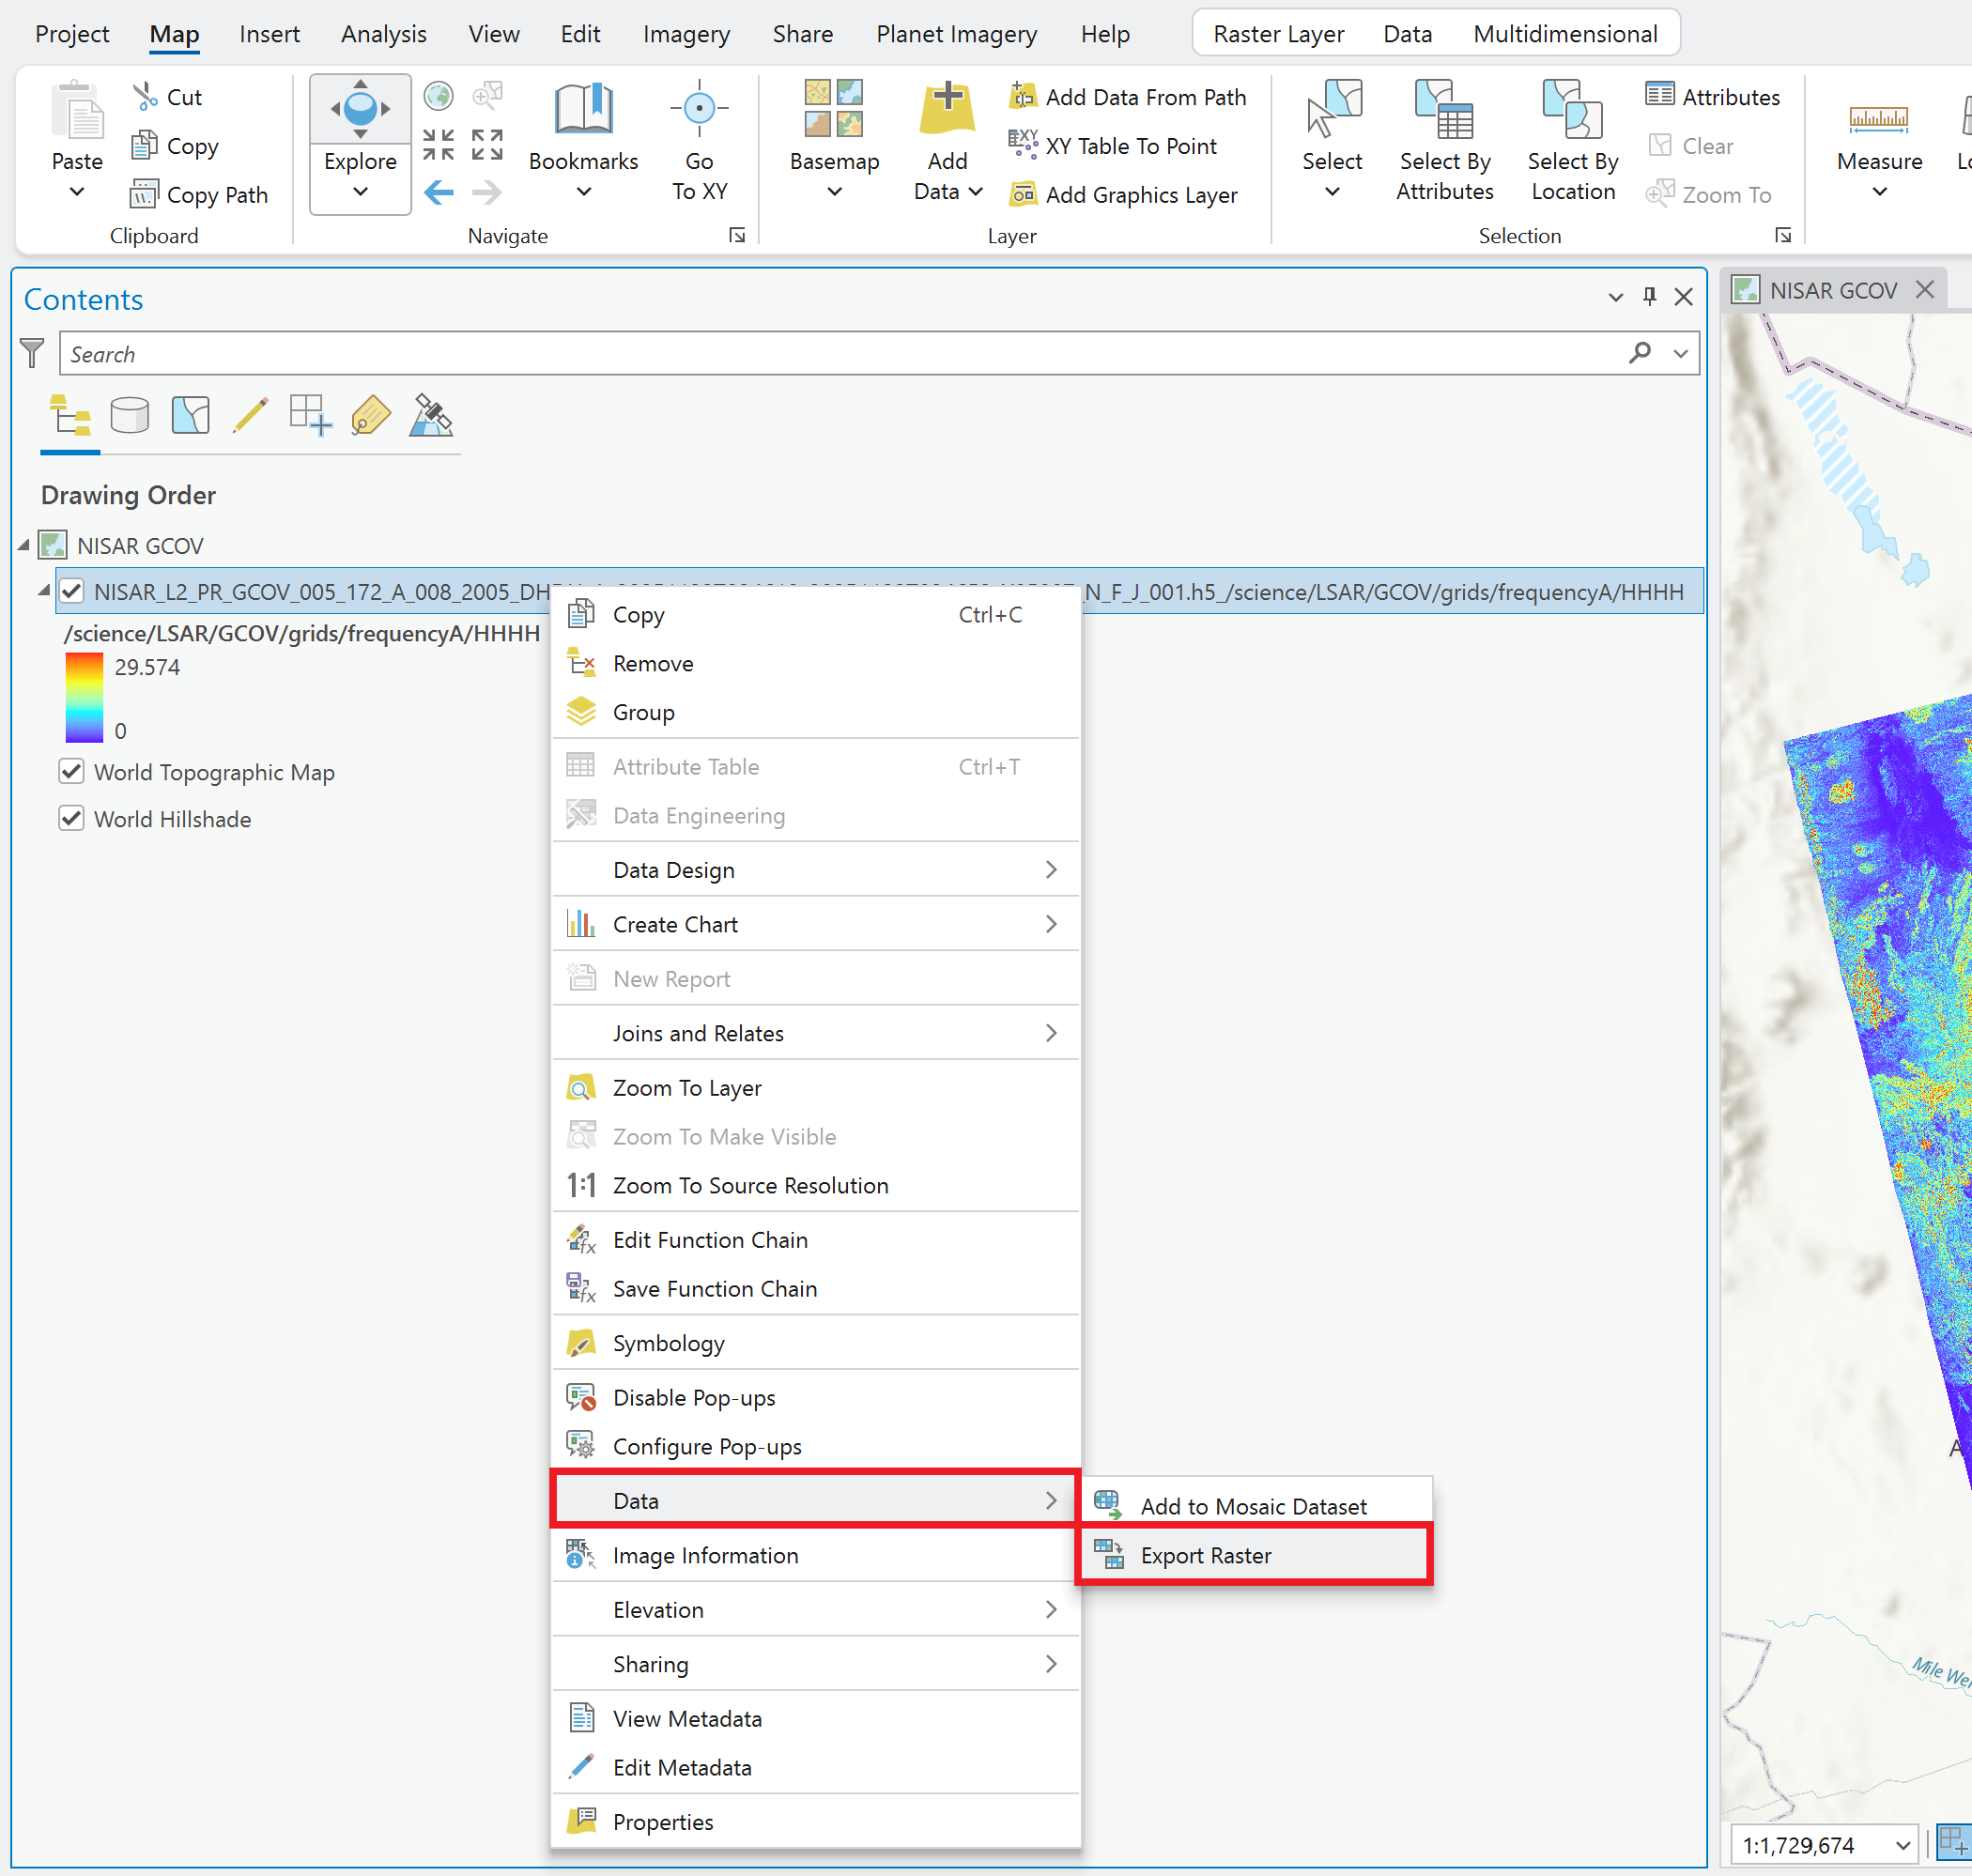
Figure 11:Accessing Export Raster from the context menu for an item in the Contents pane.
Select the layer in the Contents pane, and click the Export Raster button in the Data menu (Figure 12)
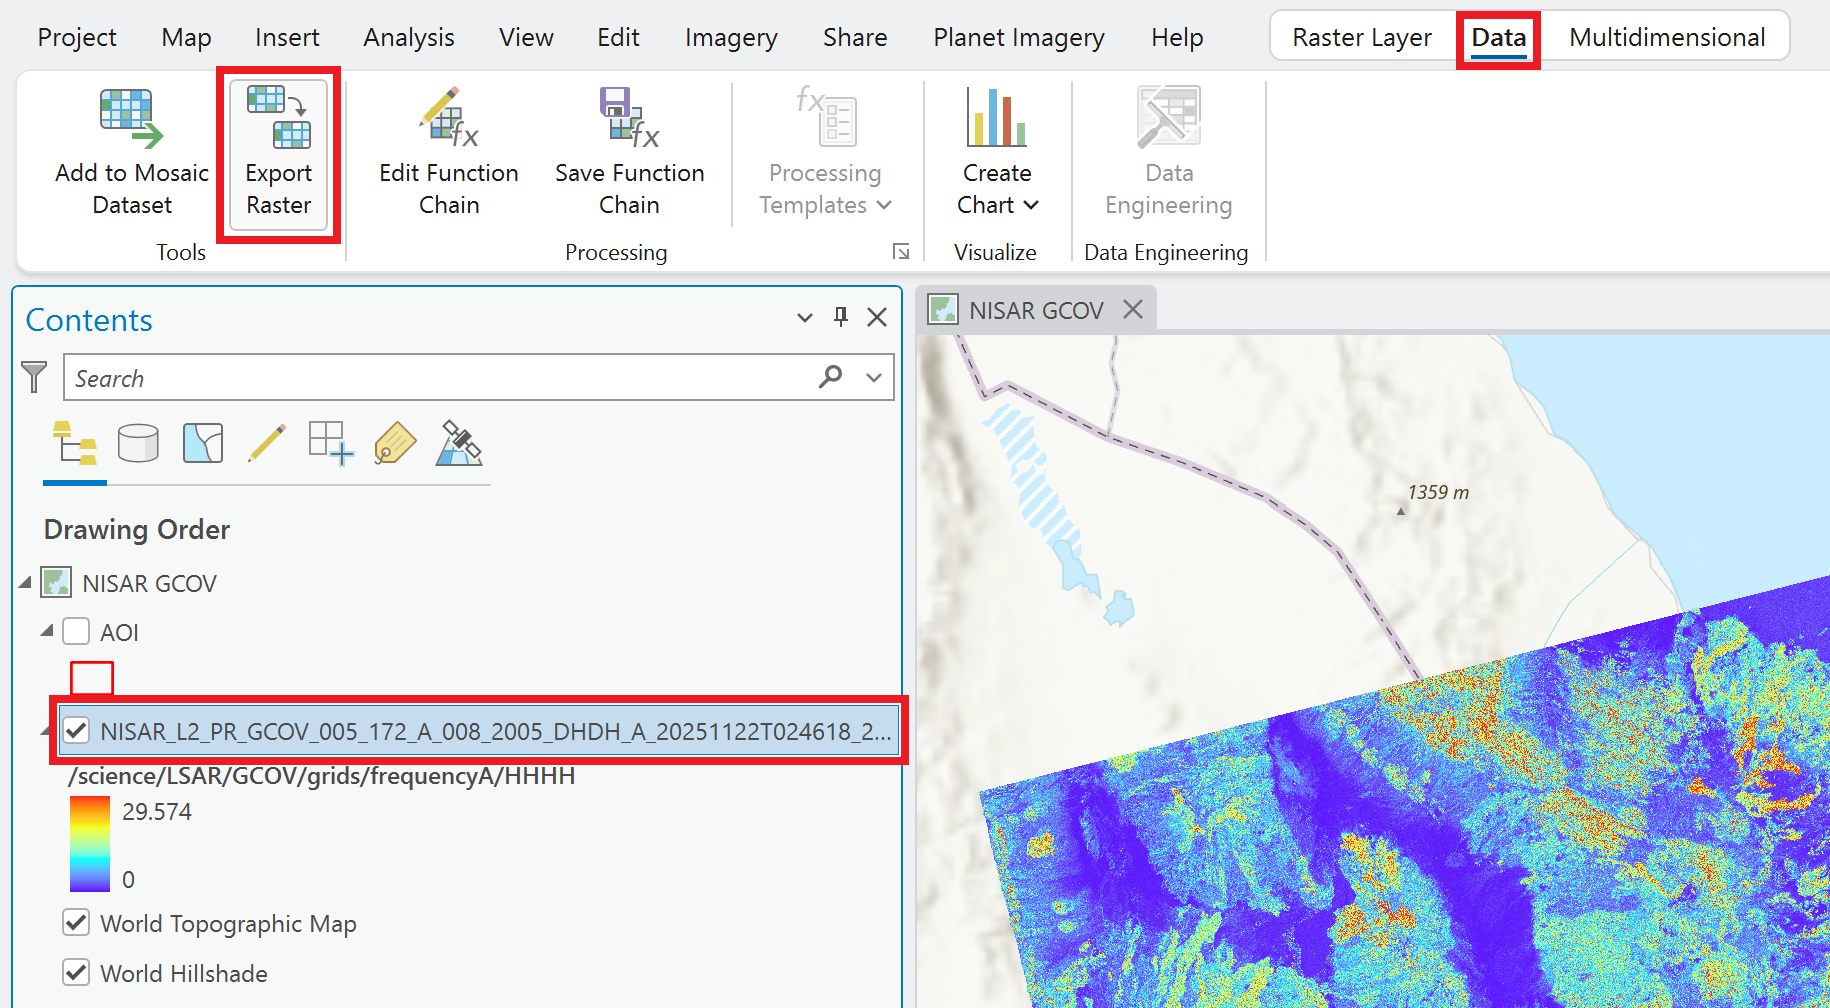
Figure 12:Accessing Export Raster from the Data menu for an item in the Contents pane.
In the Export Raster dialog window:
Set the path and filename for the output raster
Select the raster format to use
If you want to export the variable using the default settings, click the Export button
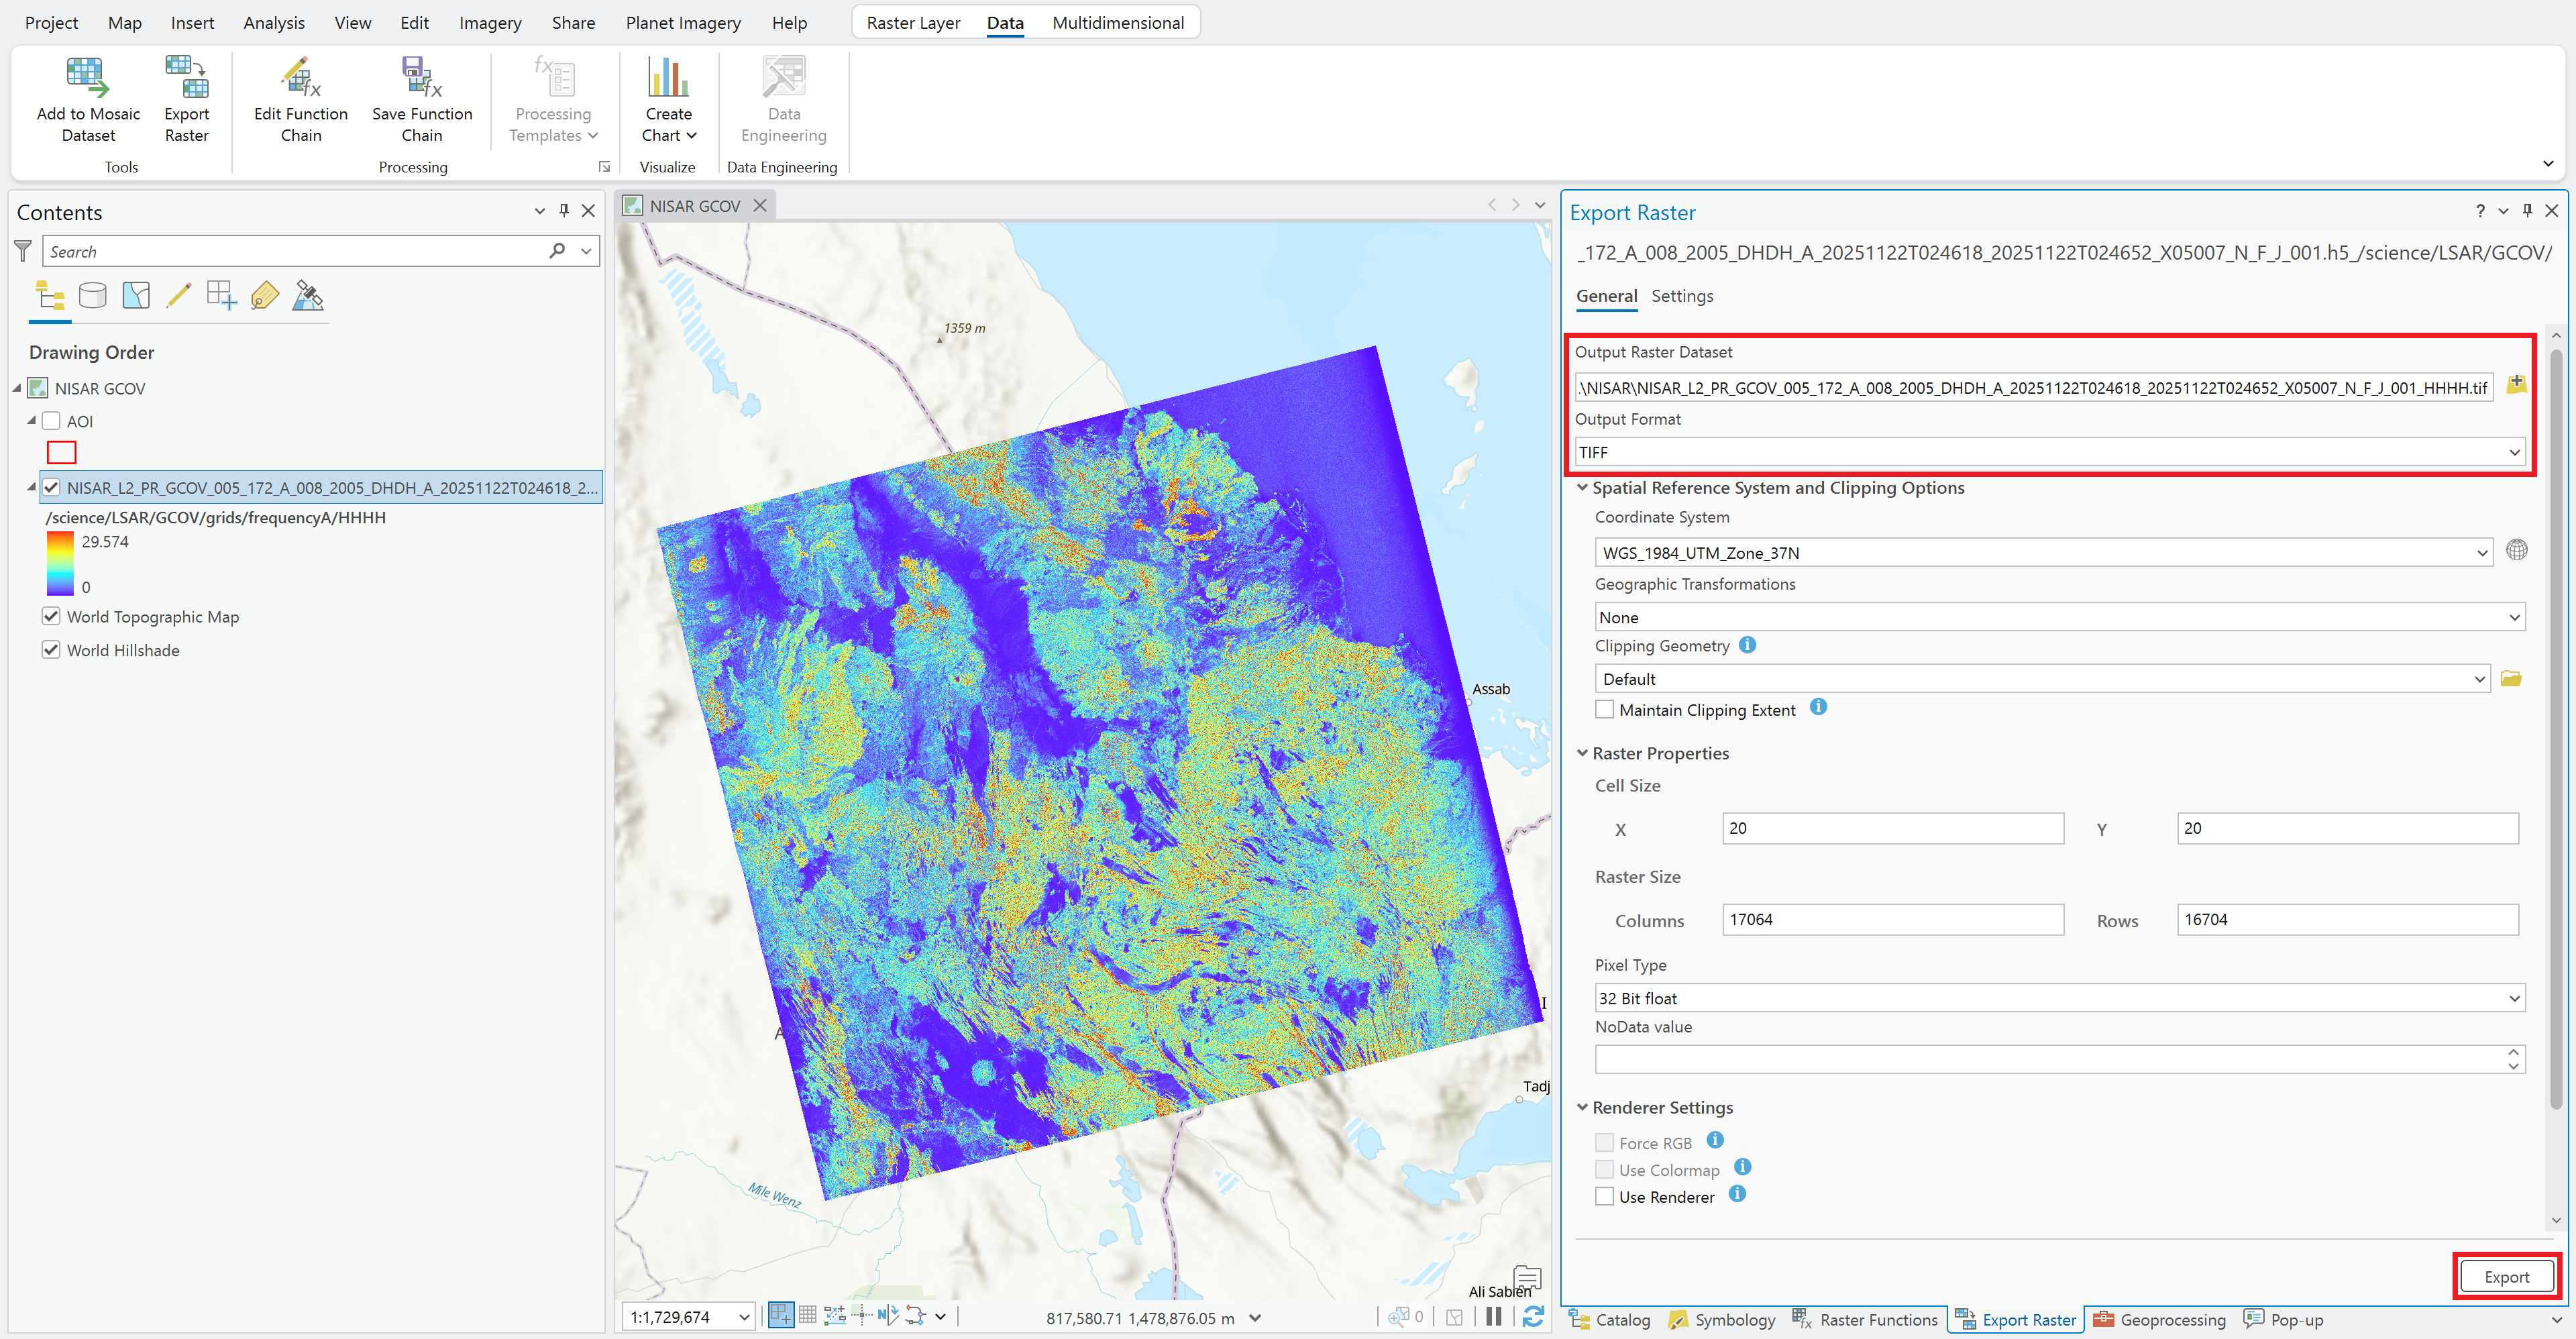
Figure 13:Set the output file path and file type in the Export Raster dialog window.
Export Raster Settings
As with the Subset Multidimensional Raster Tool, there are a number of settings that can be adjusted to apply additional data transformations when exporting the variable to a stand-alone raster.
Some of these settings are accessed directly in the General tab, including:
Coordinate system
Cell size
Pixel type
Rendering type
Compression type/quality
Additional options are available in the Settings tab, including:
Snap Raster options
Resampling options
Pyramid options
Statistics options
Spatial Subsetting
The options available for setting a spatial extent are available in the Clipping Geometry section of the General tab.
The Clipping Geometry drop-down menu provides the option to use the current map extent or the extent of a layer in the map. It’s convenient to use a feature class containing a single feature (or restricted to a single feature using a definition query) to set the extent, as illustrated by the Area of Interest (AOI) feature class used in Figure 14.
You can also click the Browse icon to navigate to a saved geospatial file, or manually enter an extent in the Extent fields.
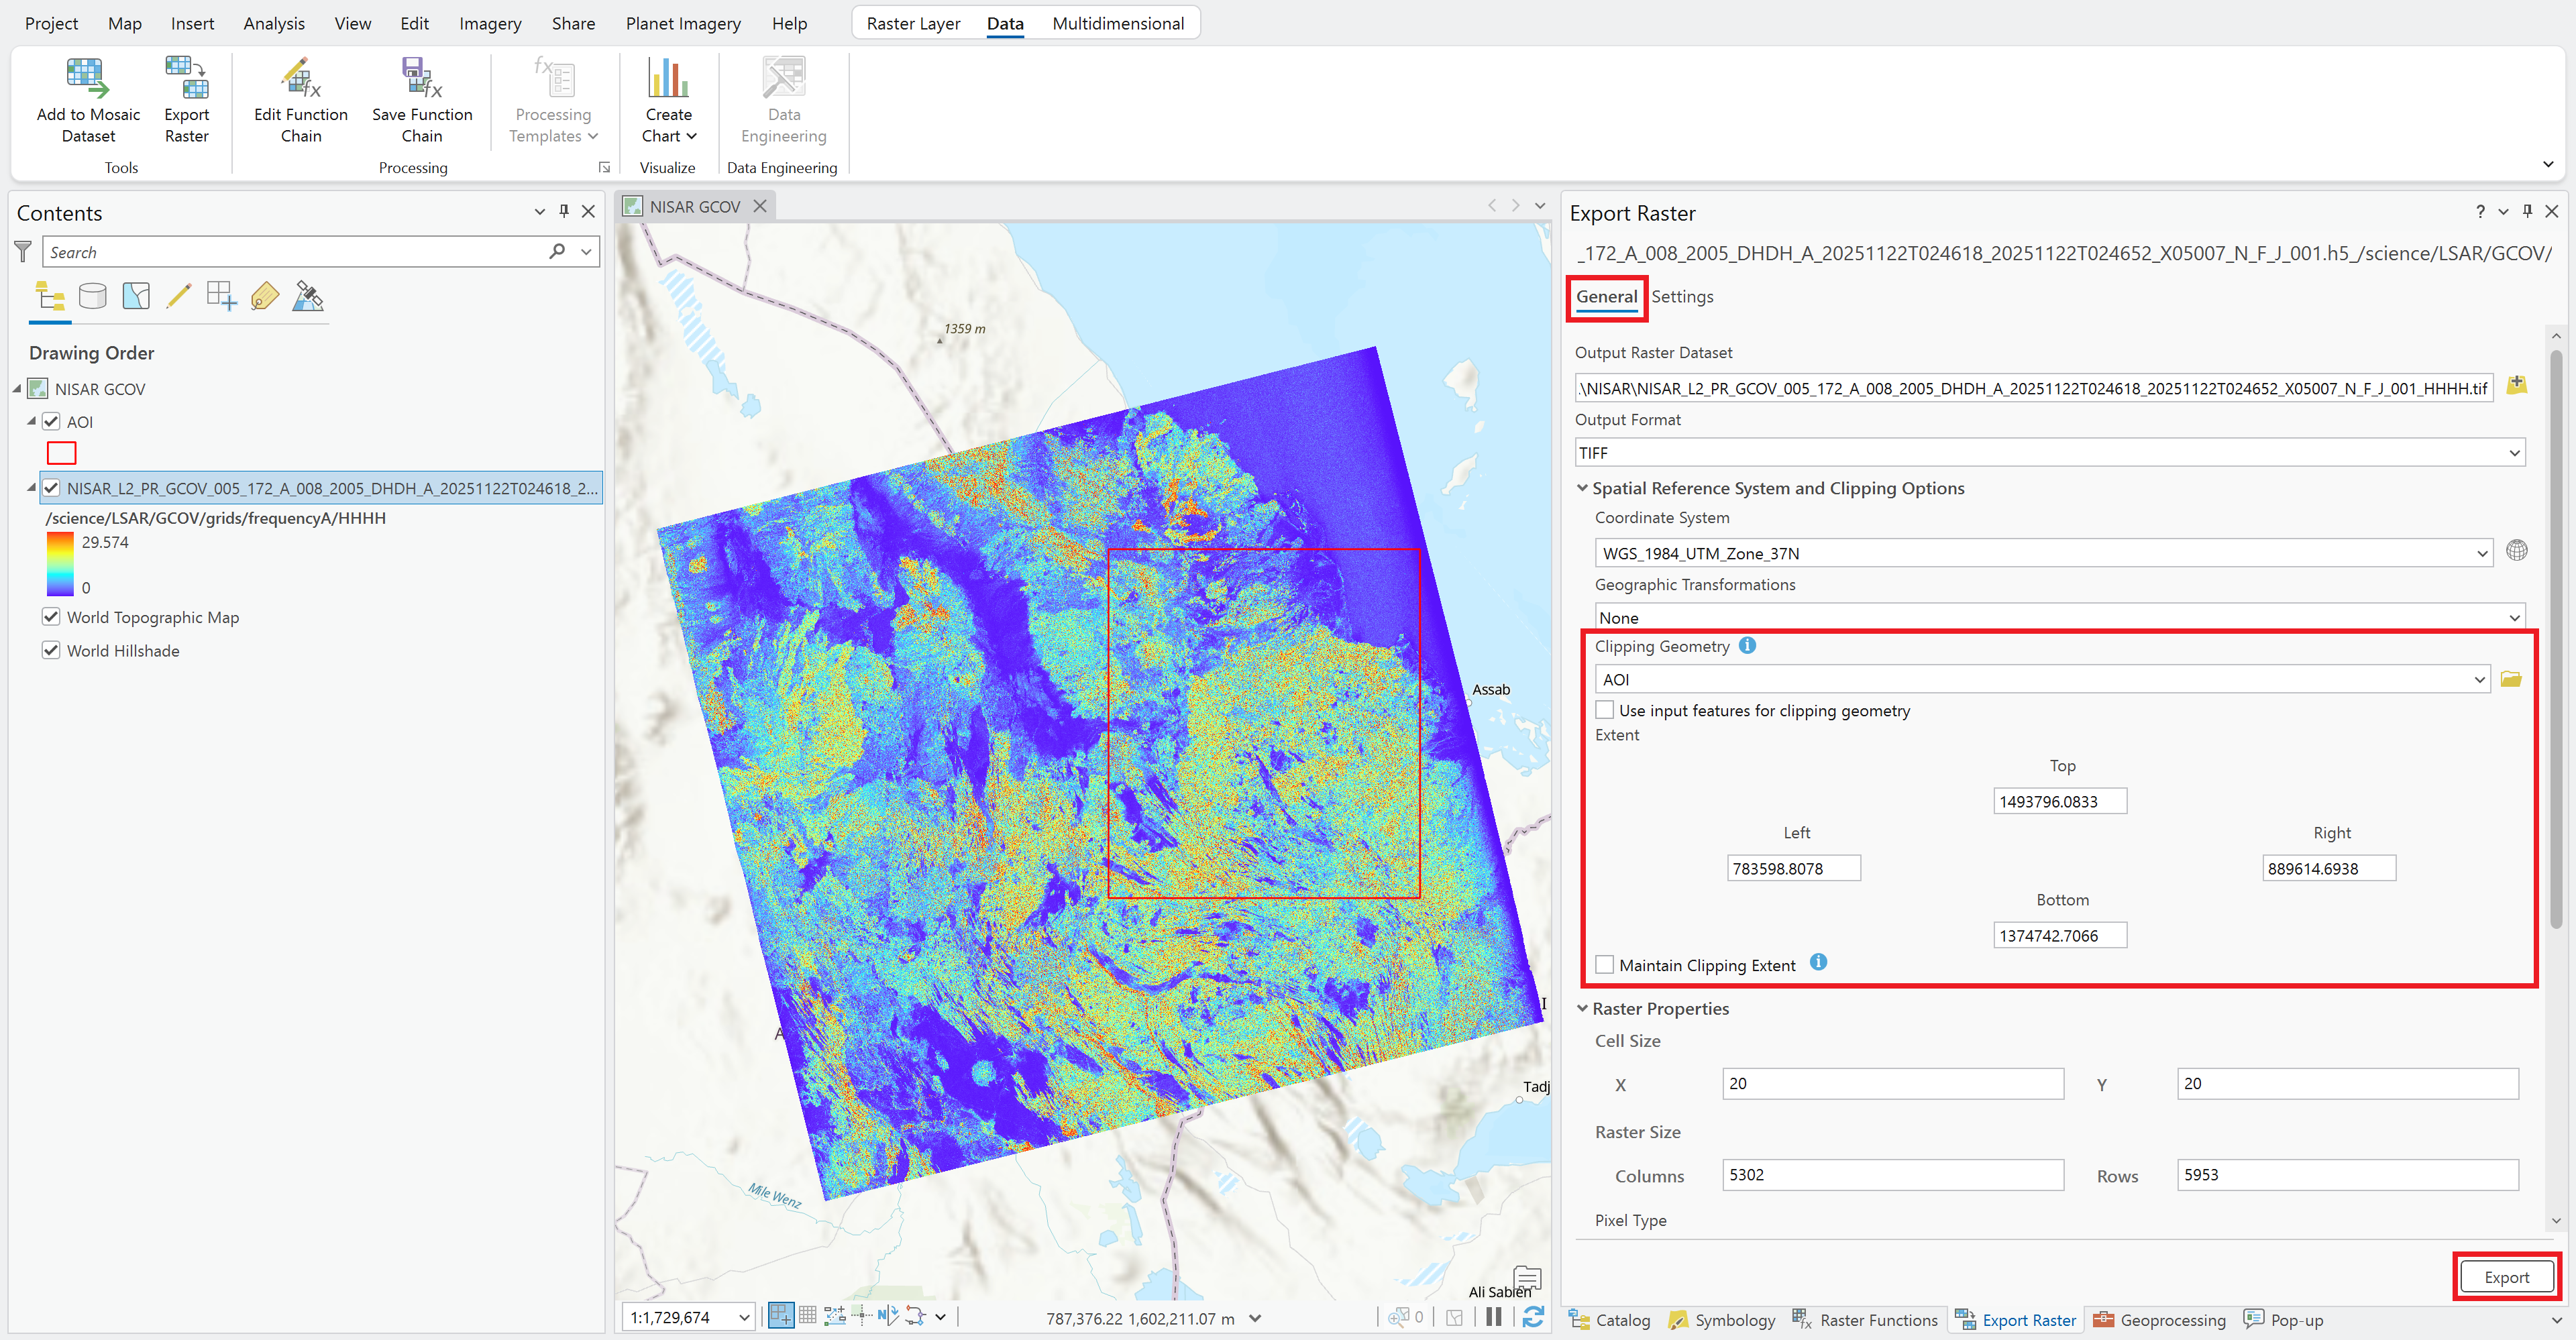
Figure 14:Set the raster extent in the Export Raster dialog window.
Once all the other settings (in both the General and Settings tabs) are set as desired, click the Export button to export the variable to a stand-alone raster with the desired spatial extent.